21 Essential Affiliate Marketing Benchmarks & KPIs for 2027

Last updated October 2026.
Affiliate marketing benchmarks are reference values, such as conversion rate, commission rate and partner activation, that show whether your program performs in line with the market. This guide covers 21 metrics using 2025–2026 data, and flags where a figure is vendor-reported or depends on the business model.
Affiliate marketing is a powerful business strategy for expanding reach–lead generation has never been more important. So, how do we measure affiliate marketing success? What affiliate marketing benchmarks or key performance indicators (KPIs) should we hold ourselves accountable to?
This comprehensive guide will explore over 21 essential affiliate marketing metrics every marketer should monitor and how they stack up against industry benchmarks. We'll explain what these metrics mean, why they're important, and how you can use them to optimize your affiliate marketing campaigns for your target audience.
Key takeaways
- Conversion is slipping while traffic grows. Impact.com data for H1 2026 shows clicks up 6% year on year and conversion rate down 12% (Web Tonic summary of Impact.com).
- SaaS commissions cluster at 20–30%. Rewardful's average is 24.16%, and the average referral-to-sale rate is 0.8% (same source).
- Activation is the bottleneck. The median SaaS program activates about 18% of approved partners (Hamster Garage).
- Fraud is a measurable cost. Fraudlogix found 20.64% invalid traffic across 105.7 billion ad impressions in 2025, with desktop the riskiest device at 27.03% (Fraudlogix).
- ROI ranges widely. The average program returns about $6.50 per $1 spent, while well-run programs reach $12–$15 (Matt McWilliams).
Treat every benchmark as a starting point. Your own trend line, by month and by partner segment, tells you more than any industry average.
What is the sifference between benchmarks, KPIs, and metrics?
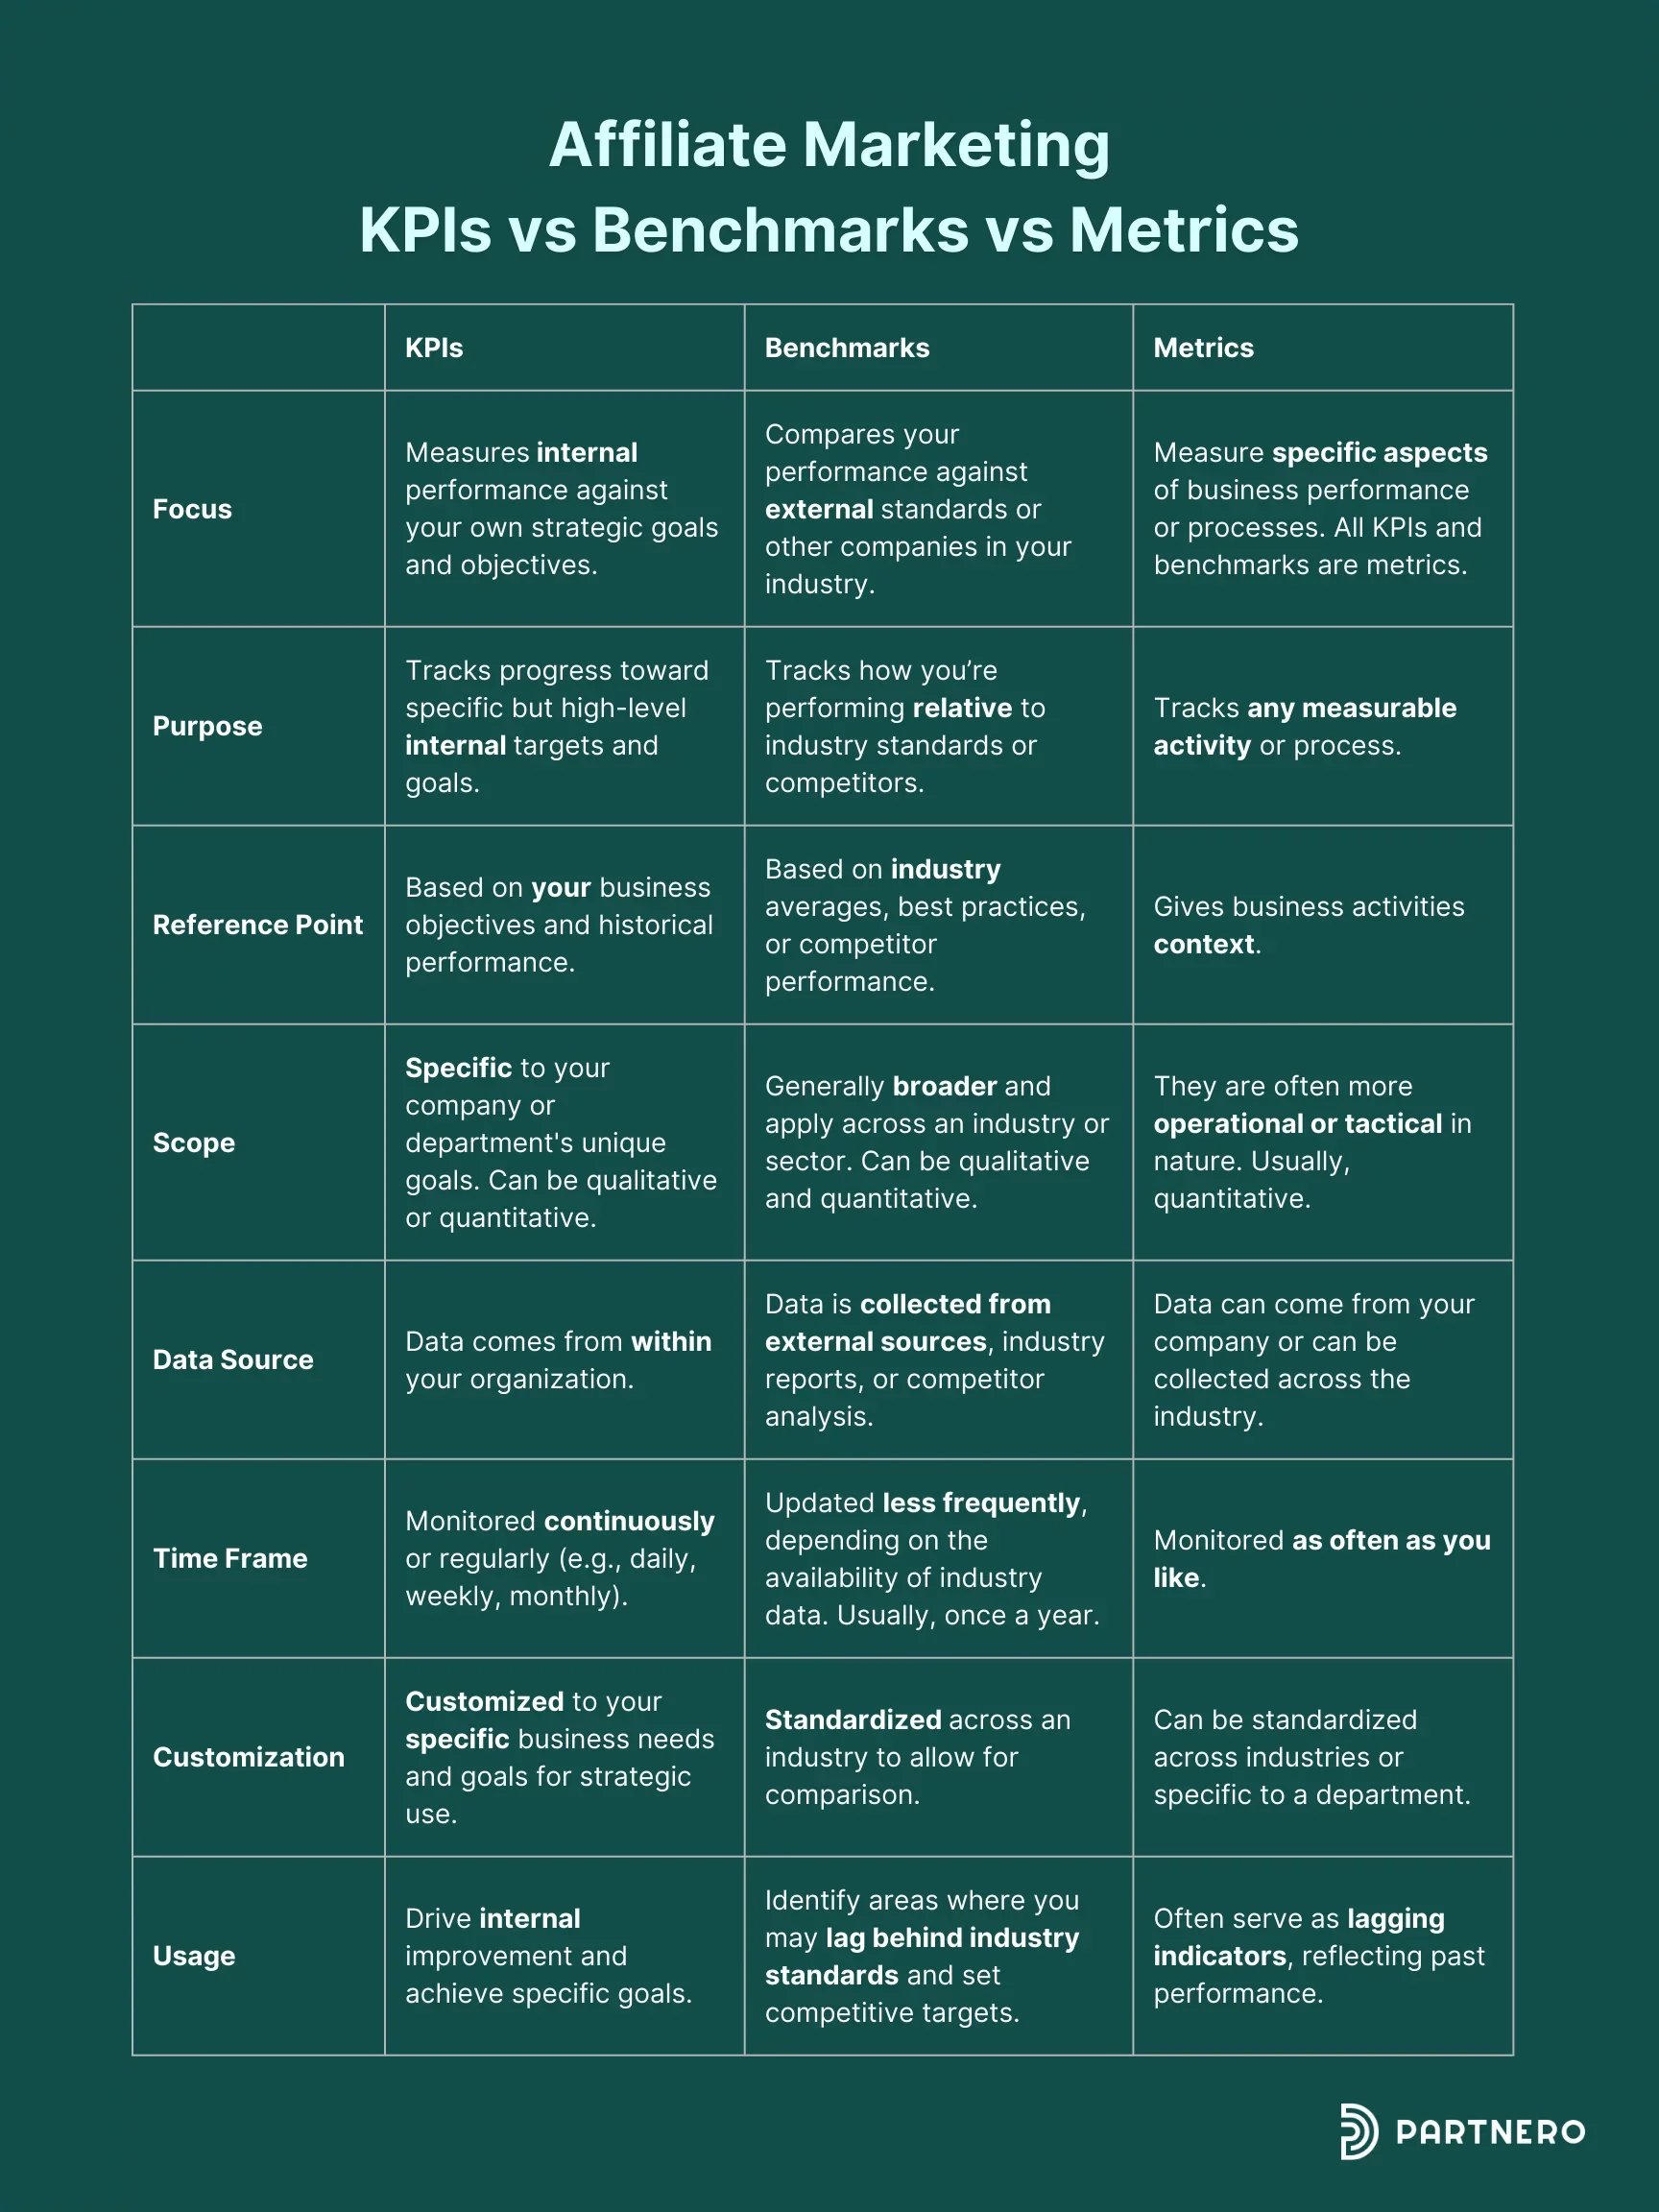
A metric is any measurement, a KPI is a metric tied to a business goal, and a benchmark is the outside reference point you compare it against.
Term | What it is | Example |
|---|---|---|
Metric | Any measurement of an activity or process | Clicks, signups, revenue per partner |
KPI | A metric you track against a target because it ties to a goal | "Raise partner activation from 18% to 30% by Q2" |
Benchmark | A reference value from your industry, peers or your own history | "Median SaaS affiliate activation is about 18%" |
It's worth noting that KPIs and benchmarks can be complementary. Every KPI is a metric, but not every metric is a KPI. Benchmarks help you set realistic KPI targets, and your KPIs are the numbers you later benchmark against other programs. Each of the 21 metrics below is labeled as a benchmark, a KPI, or both.
In summary:
- KPIs are strategic indicators tied to specific business goals.
- Benchmarks are comparative measures against external standards.
- Metrics are broader measurements of any business activity or process.
Traffic and conversion metrics (1–5)
No matter what your goals are in affiliate marketing–brand awareness, lead generation, or increased sales, it’s important to monitor and measure your progress in a given period. Here are some metrics to set as KPIs or benchmark your affiliate marketing progress against.
1. Click-Through Rate (CTR)
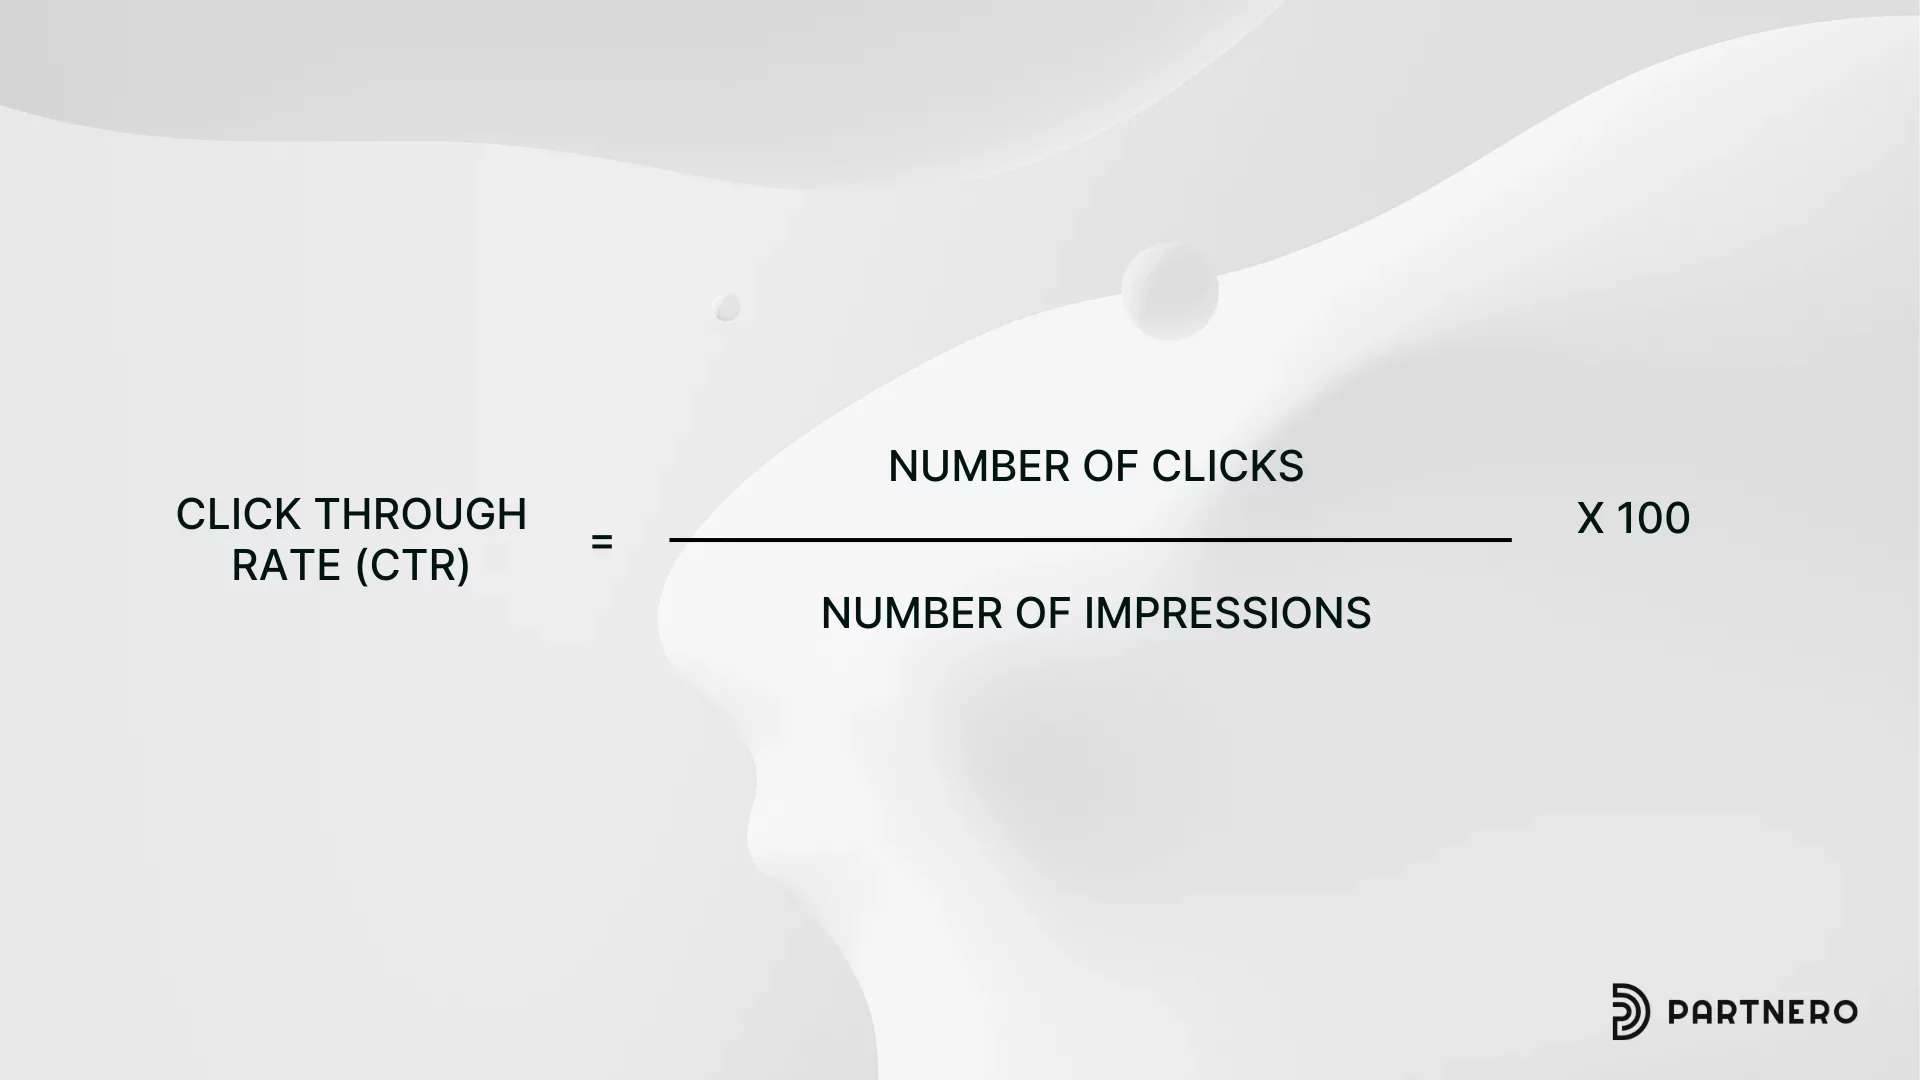
CTR is the share of people who click your affiliate link after seeing it: clicks ÷ impressions × 100.
Benchmark: 0.5%–1% is a common range for affiliate content (iREV); results above 1% are strong.
Why it matters: CTR shows whether a partner's content earns attention. Read it next to conversion rate, because clicks are growing faster than sales (see metric 2). Benchmark or KPI.Click-through rate is an important and fundamental metric that measures the percentage of people who click on your affiliate link after viewing it.
2. Conversion Rate
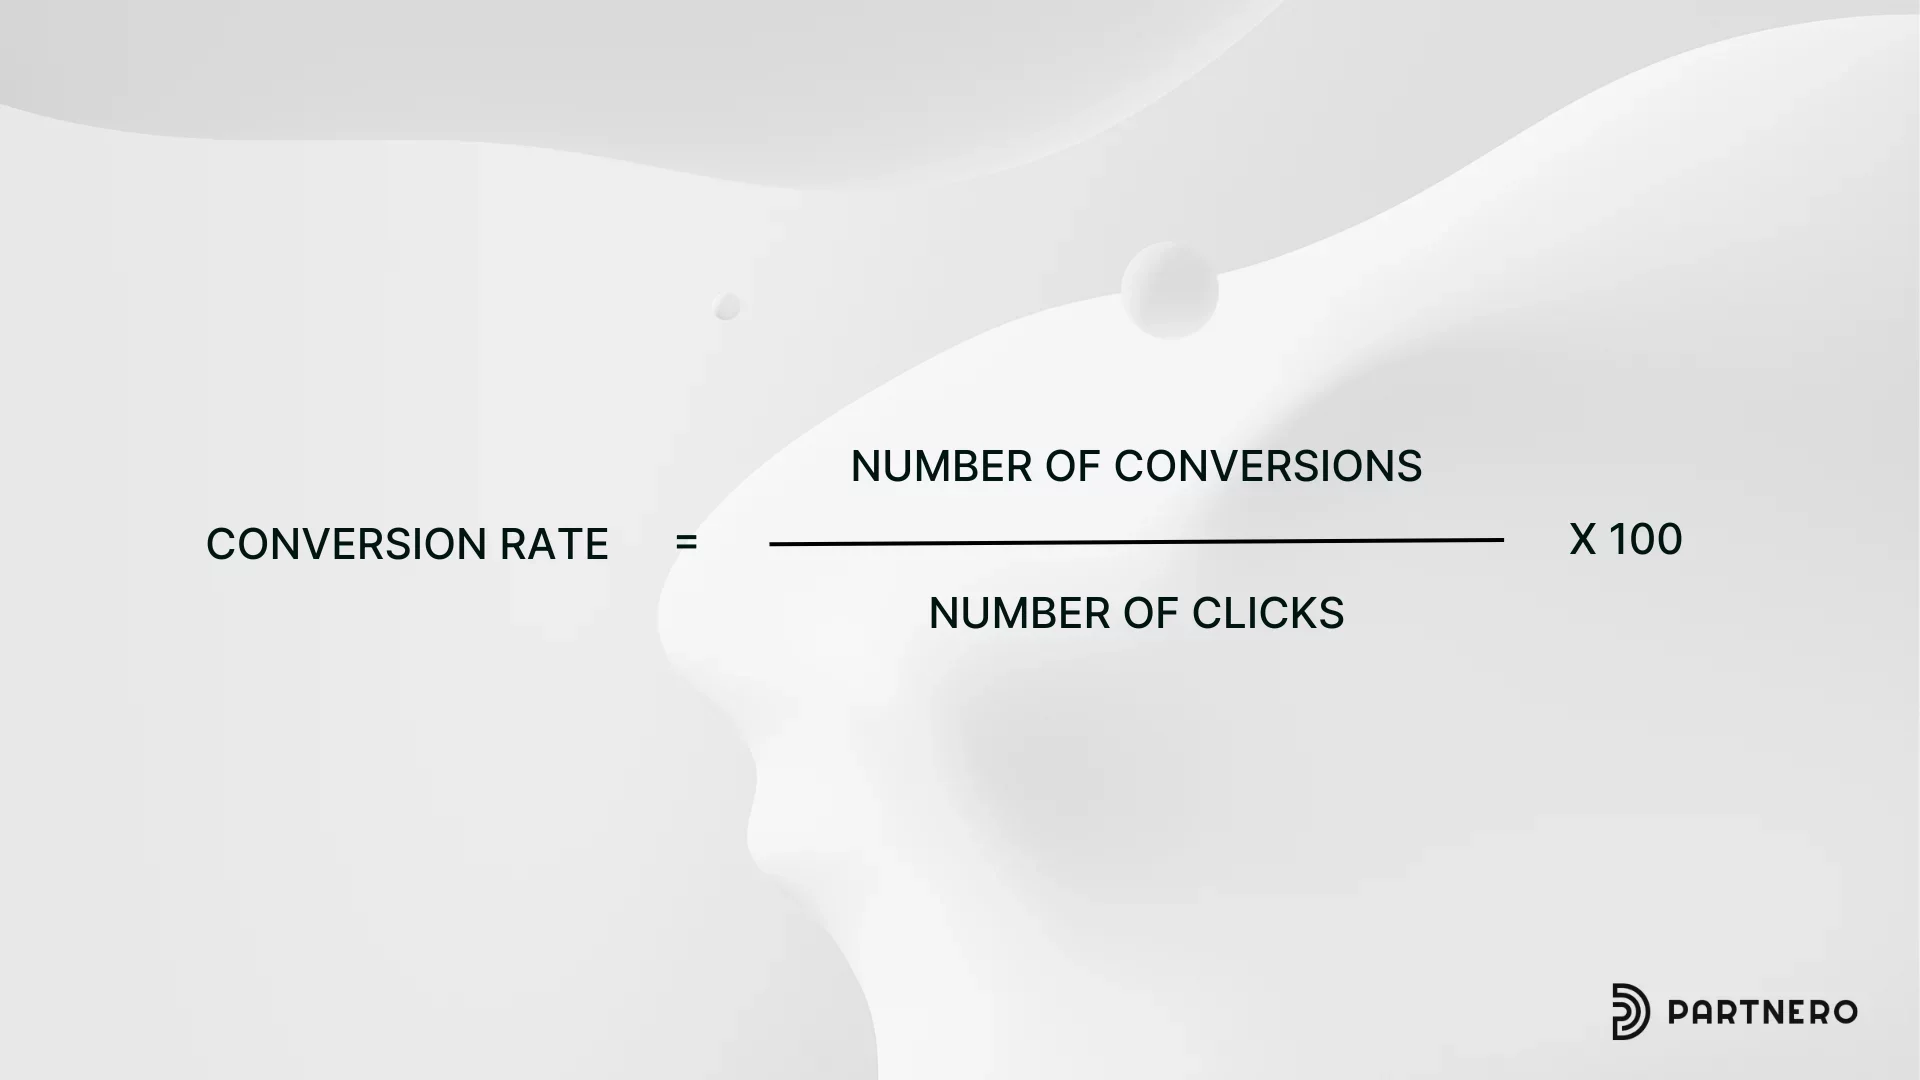
Conversion rate is the share of clicks that complete the desired action, such as a signup, trial or purchase: conversions ÷ clicks × 100.
Benchmark: Affiliate traffic typically converts at 1–3%, with top programs near 5% (Impact.com, via UpPromote). SaaS programs see 3–7% click-to-trial and 1–3% click-to-paid (Hamster Garage). The 0.8% referral-to-sale average covers direct-to-paid journeys only (Web Tonic).
Trend: In H1 2026, clicks rose 6% while conversion rate fell 12% across 2,319 brands. In full-year 2025, clicks rose 2% and conversion rate fell 6% (Impact.com, via Web Tonic). Shoppers research longer before they buy.
Why it matters: It sets your earning potential and shows partner and landing-page quality. Benchmark or KPI.
3. Average Order Value (AOV)
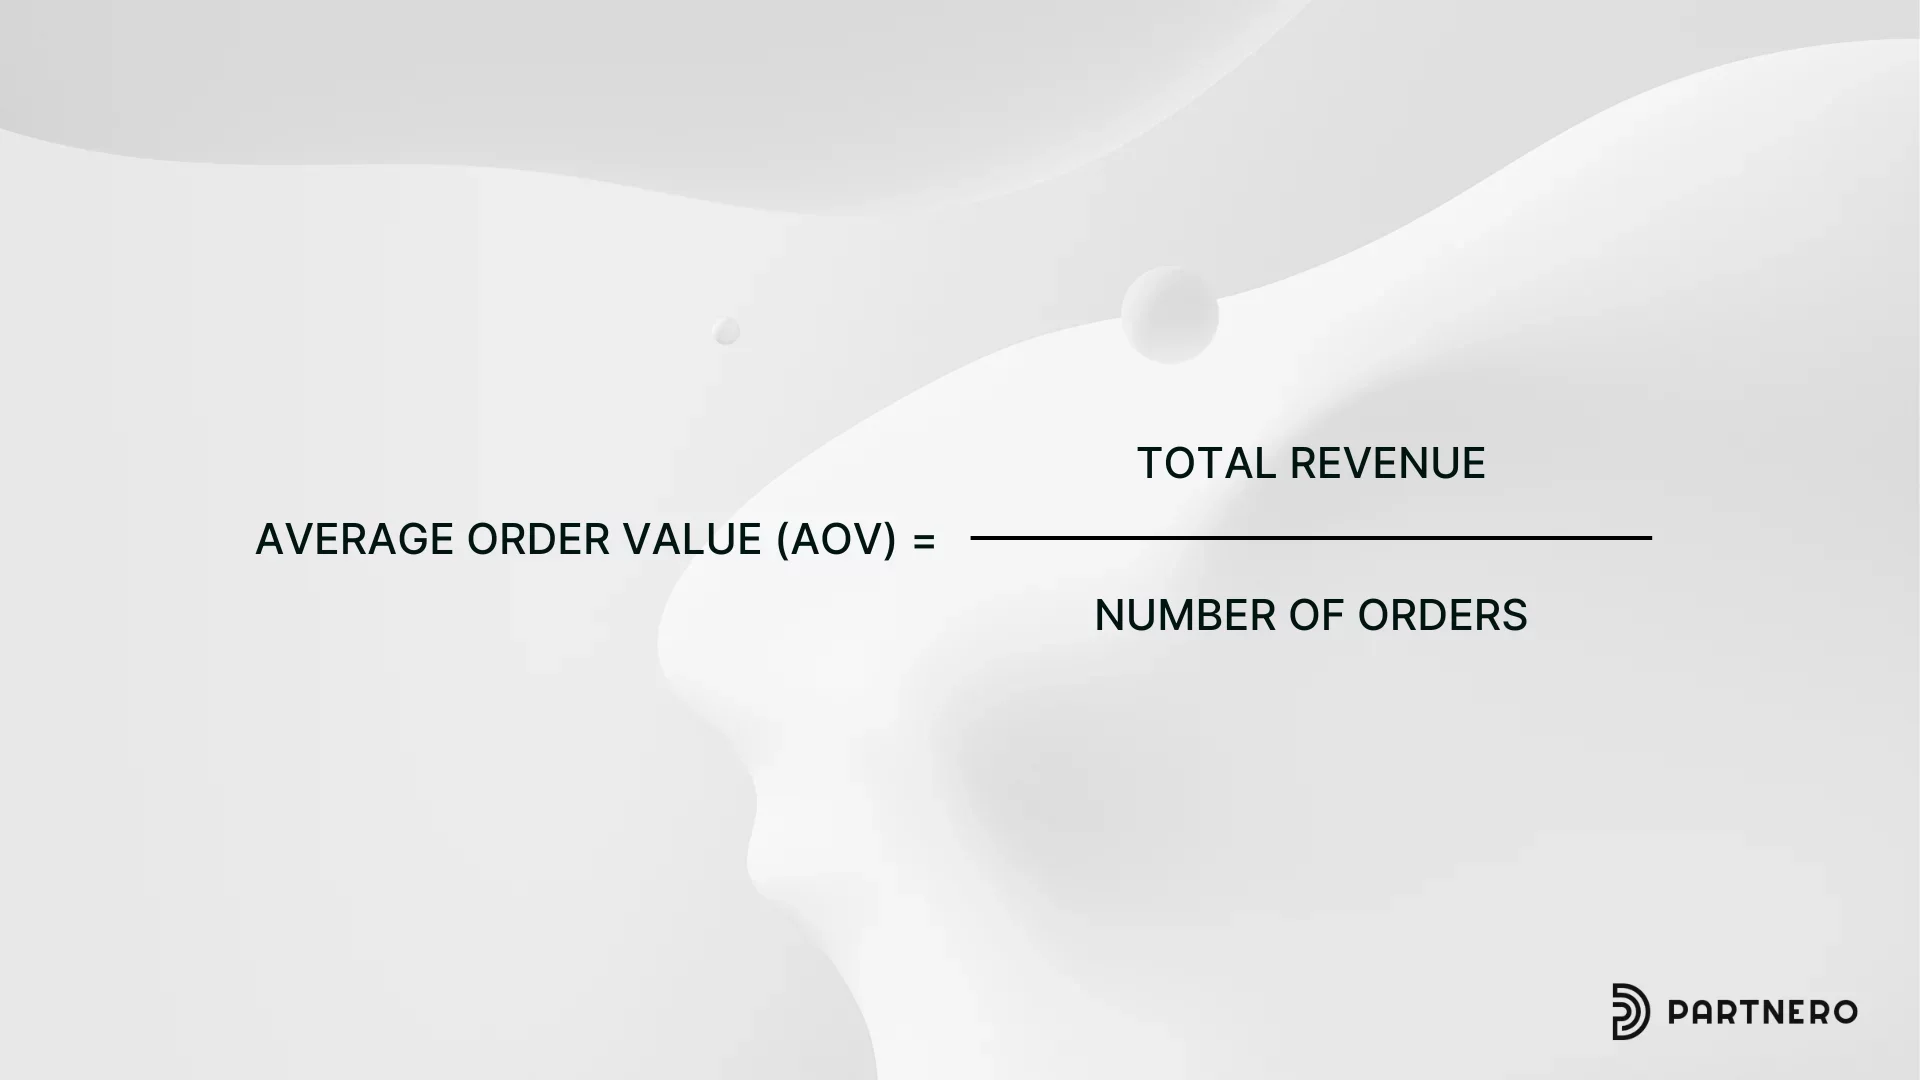
AOV is the average amount spent per transaction through affiliate links: revenue ÷ orders.
Benchmark: Impact.com network data shows affiliate AOV reaching about $130 in H1 2026, up from $111 a year earlier (via Web Tonic). Awin and Forrester analysis from 2024 found affiliate-acquired customers spend 21% more per order than customers from paid channels (Matt McWilliams).
Why it matters: Higher AOV can lift revenue without more traffic, and it offsets falling conversion rates. Benchmark or KPI.
4. Earnings Per Click (EPC)
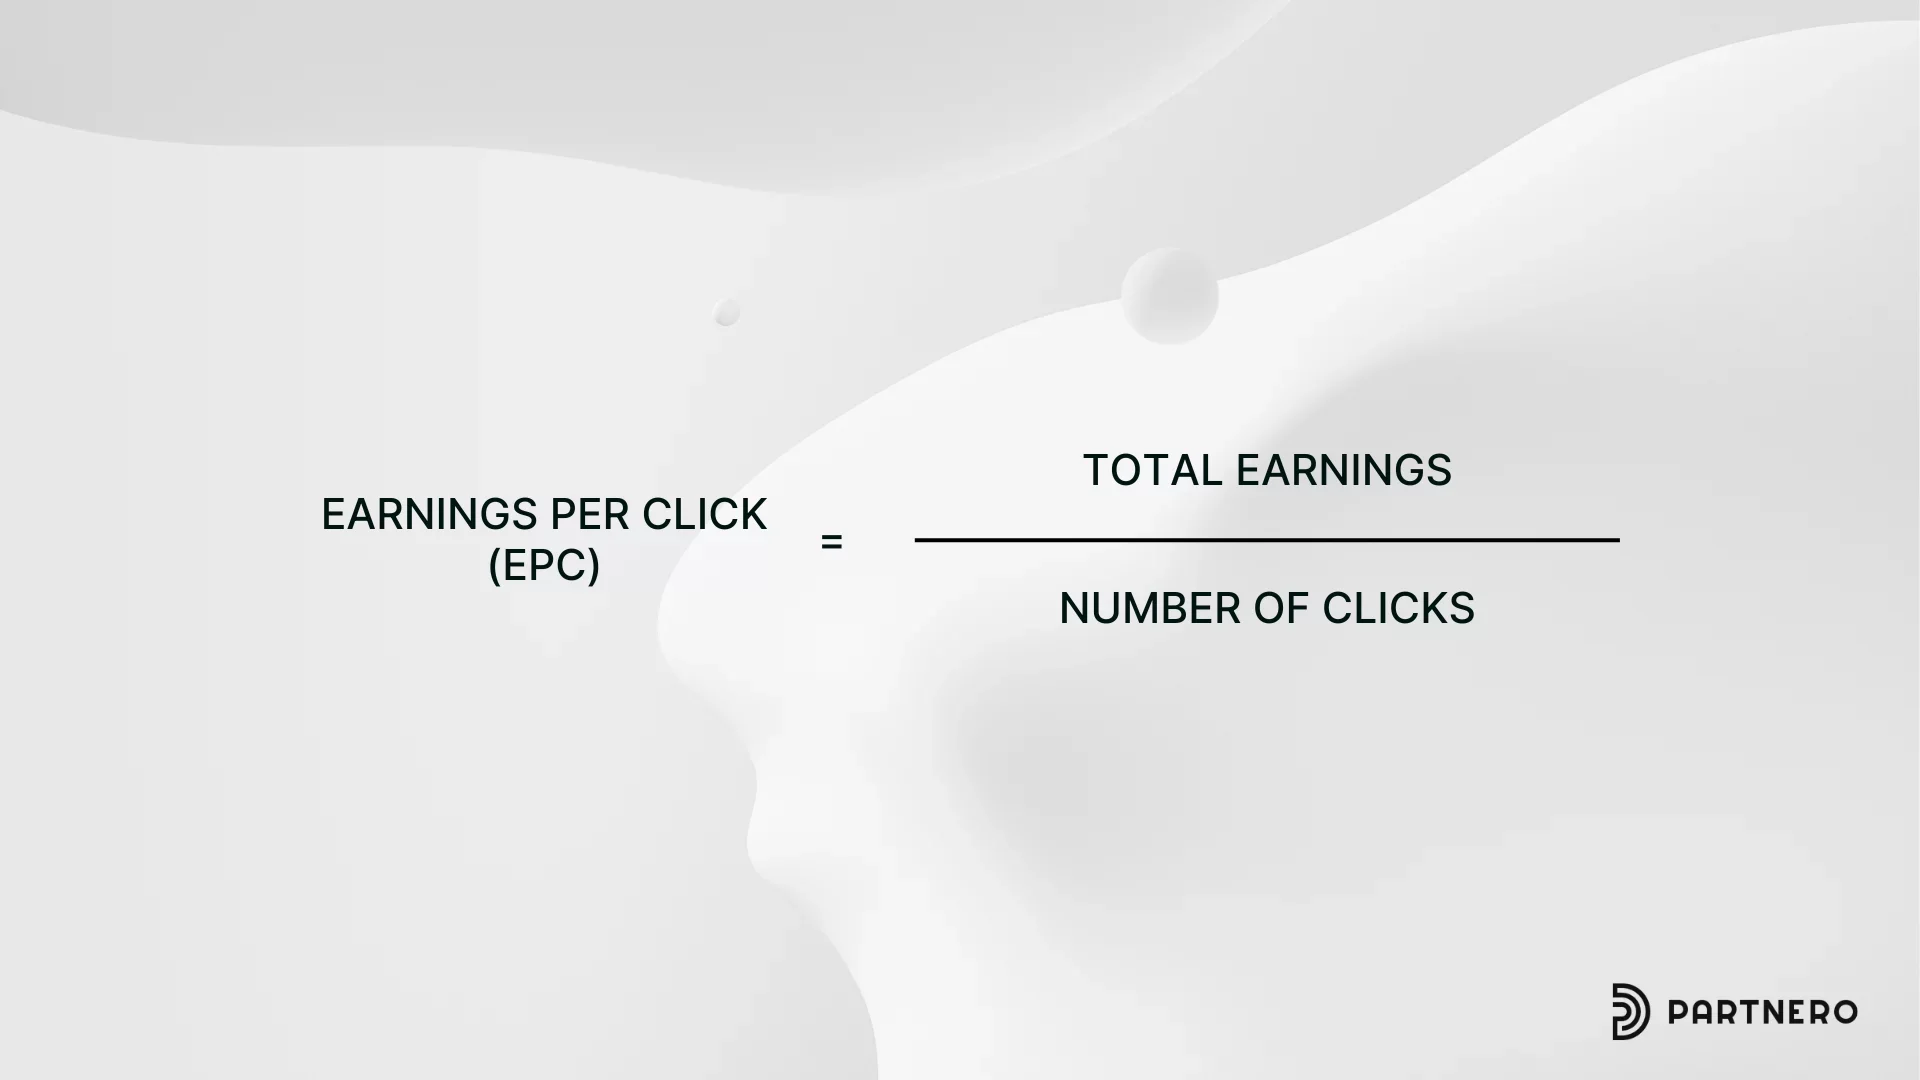
EPC is the average commission earned per click: total commissions ÷ total clicks.
Benchmark: SaaS EPC runs $1.20–$3.50 for consumer products and $0.45–$1.90 for B2B (Hamster Garage, vendor-reported). Below about $0.50, experienced affiliates tend to deprioritize a program.
Why it matters: EPC is the number affiliates use to compare programs. If it is low while your commission is competitive, look at conversion first. Benchmark or KPI.
5. Revenue Per Visitor (RPV)
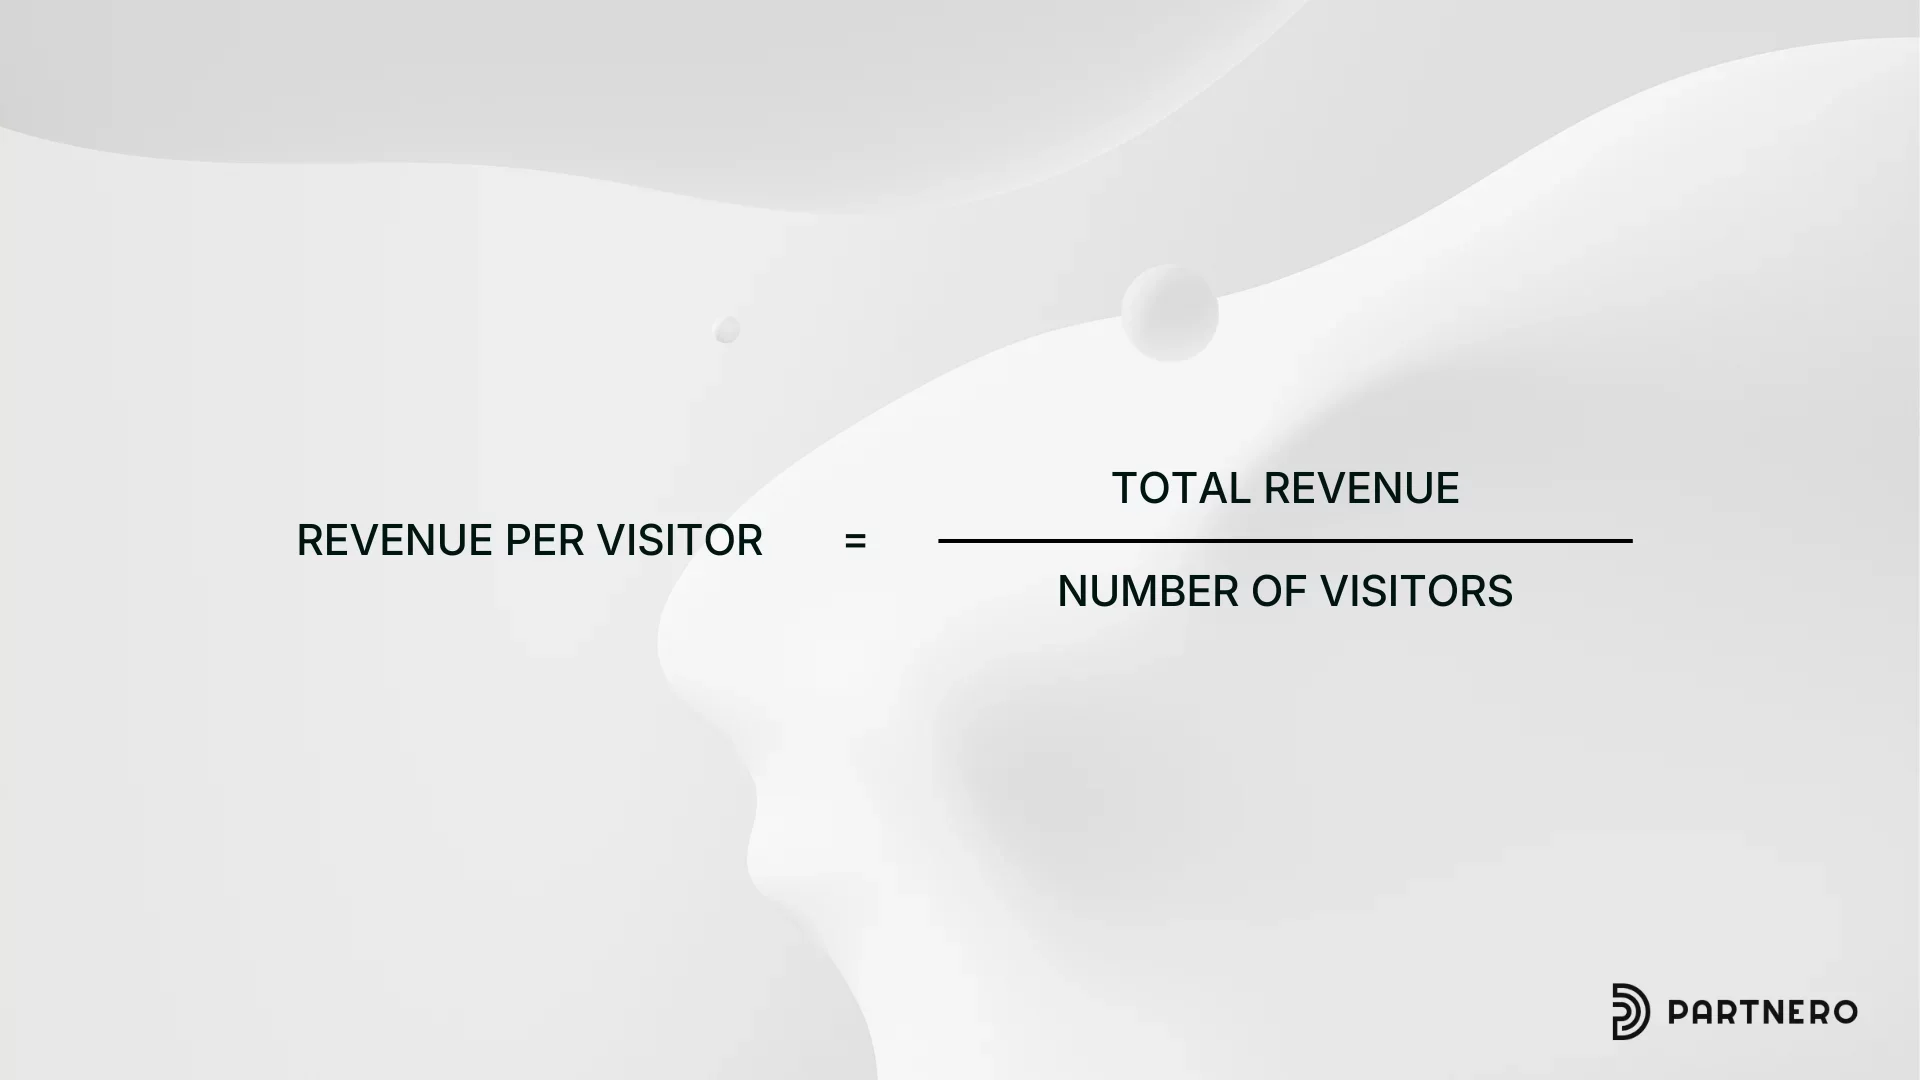
RPV is the revenue generated per visitor to affiliate-driven pages: revenue ÷ visitors.
Benchmark: No reliable cross-industry figure exists for brands. On the publisher side, Authority Hacker puts revenue per 1,000 visitors near $149.76 (via iREV). Set your own baseline by traffic source and compare it with EPC and your margin.
Why it matters: RPV shows the value of traffic, not just its volume, and guides where to invest. KPI.
Cost, return and journey metrics (6–11)
6. Cost Per Acquisition (CPA)
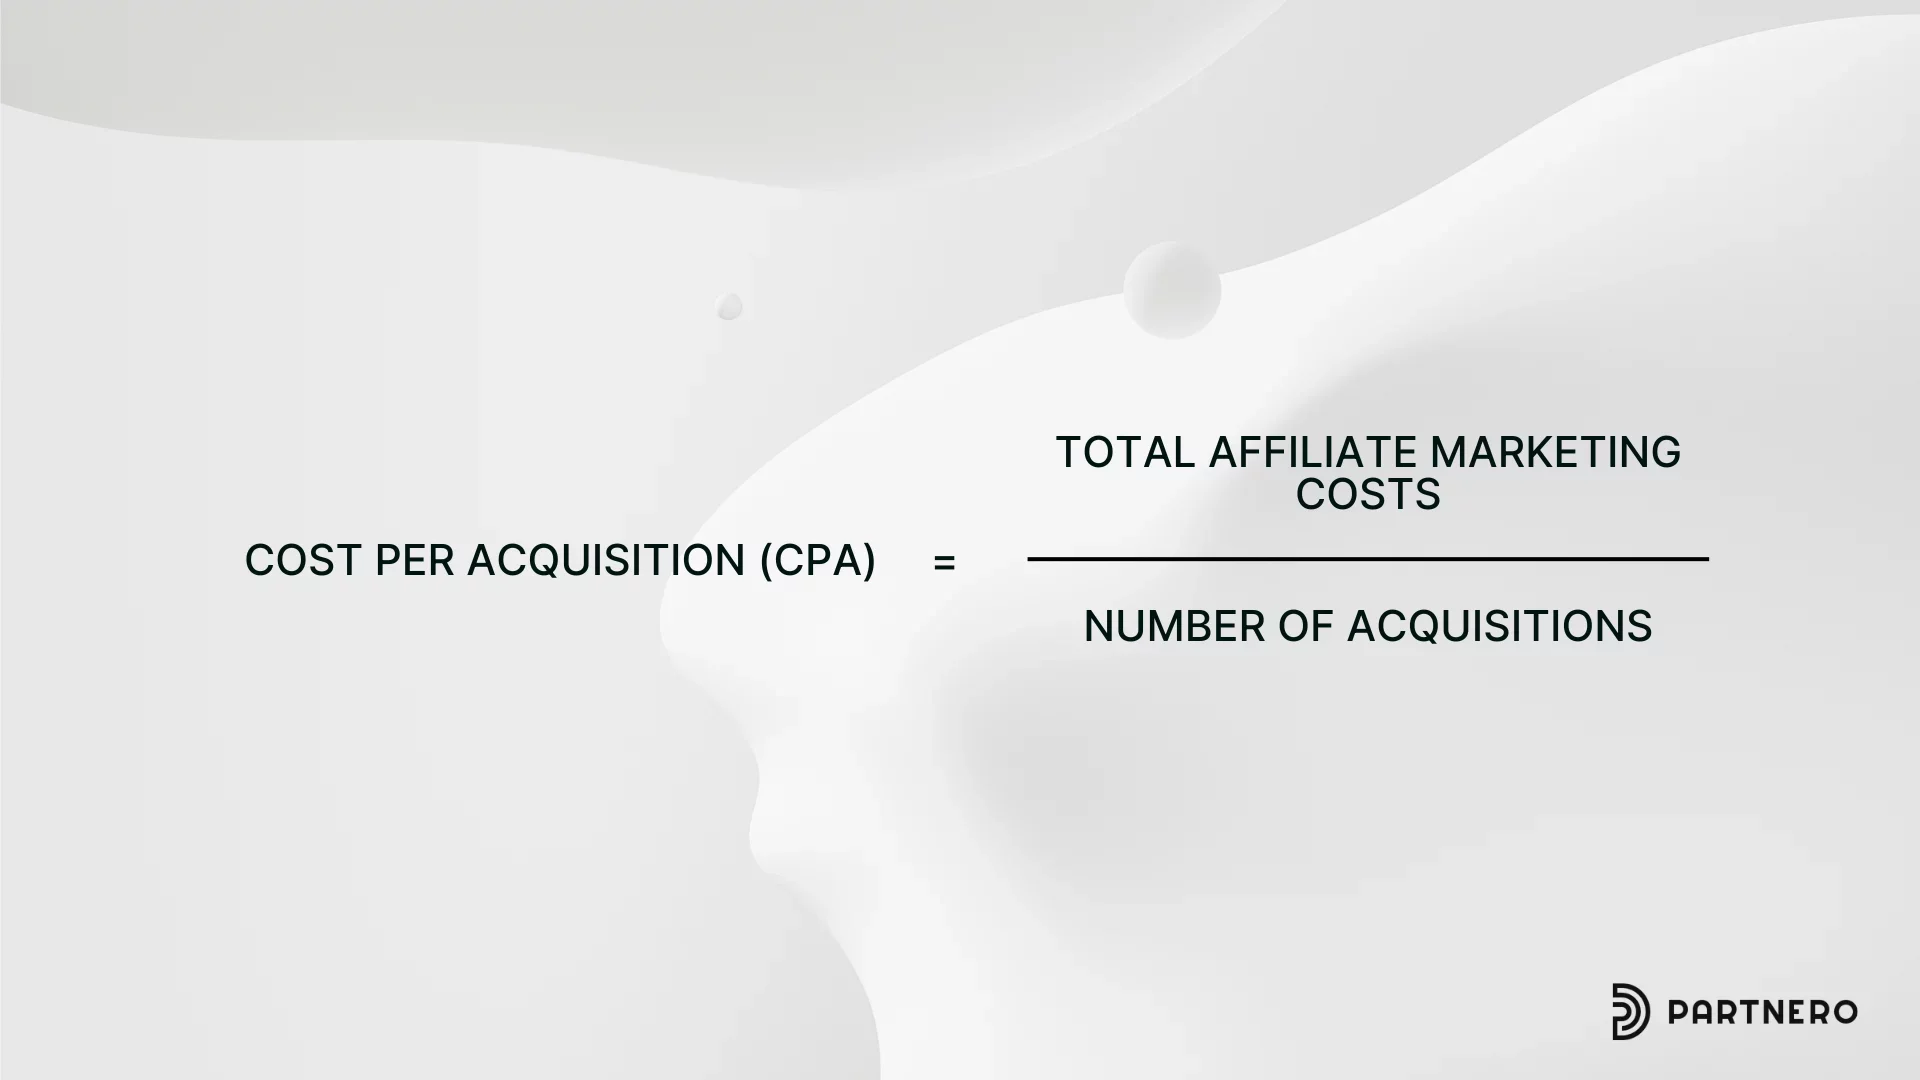
CPA is the average cost to win a new customer through affiliates: total acquisition cost ÷ new customers.
Benchmark: B2B SaaS programs pay roughly $90–$380 per acquisition, from $90–$150 for an SMB trial or demo to $250–$380 for an enterprise contract (Hamster Garage, vendor-reported). In finance, flat CPA payouts of $50–$200 are common (Rewardful). A good CPA leaves a customer lifetime value of at least 3× the cost (see metric 17).
Why it matters: CPA shows whether the channel is profitable. Benchmark or KPI.
7. Cost Per Lead (CPL)
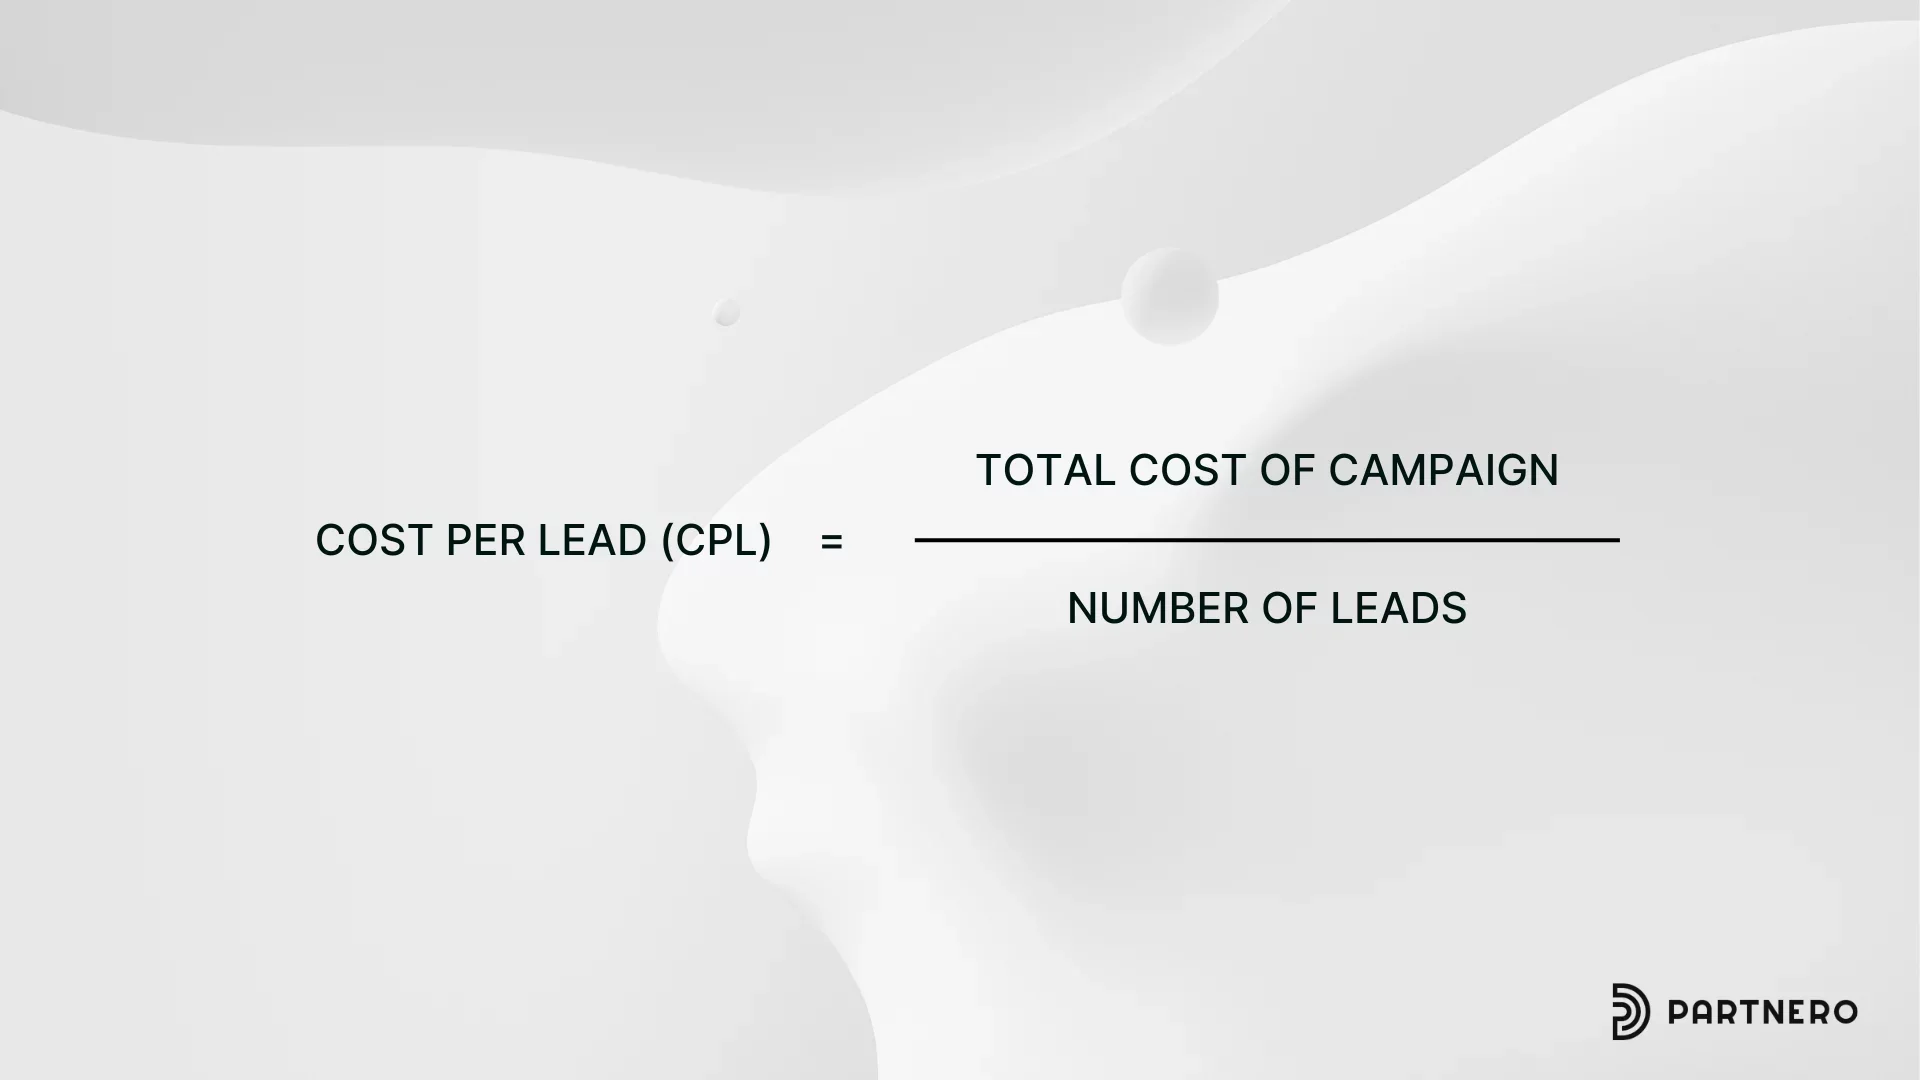
CPL is the cost of each lead: spend ÷ leads. A lead is a prospect who has shared contact details or taken a qualifying action.
Benchmark: Financial-services programs often pay about $20–$40 per qualified lead (Rewardful). Lower is better, but only relative to your lead-to-customer rate and margins.
Why it matters: CPL helps set commission rates for lead-based programs and control cost as you scale. More often a KPI.
8. Return on Ad Spend (ROAS)
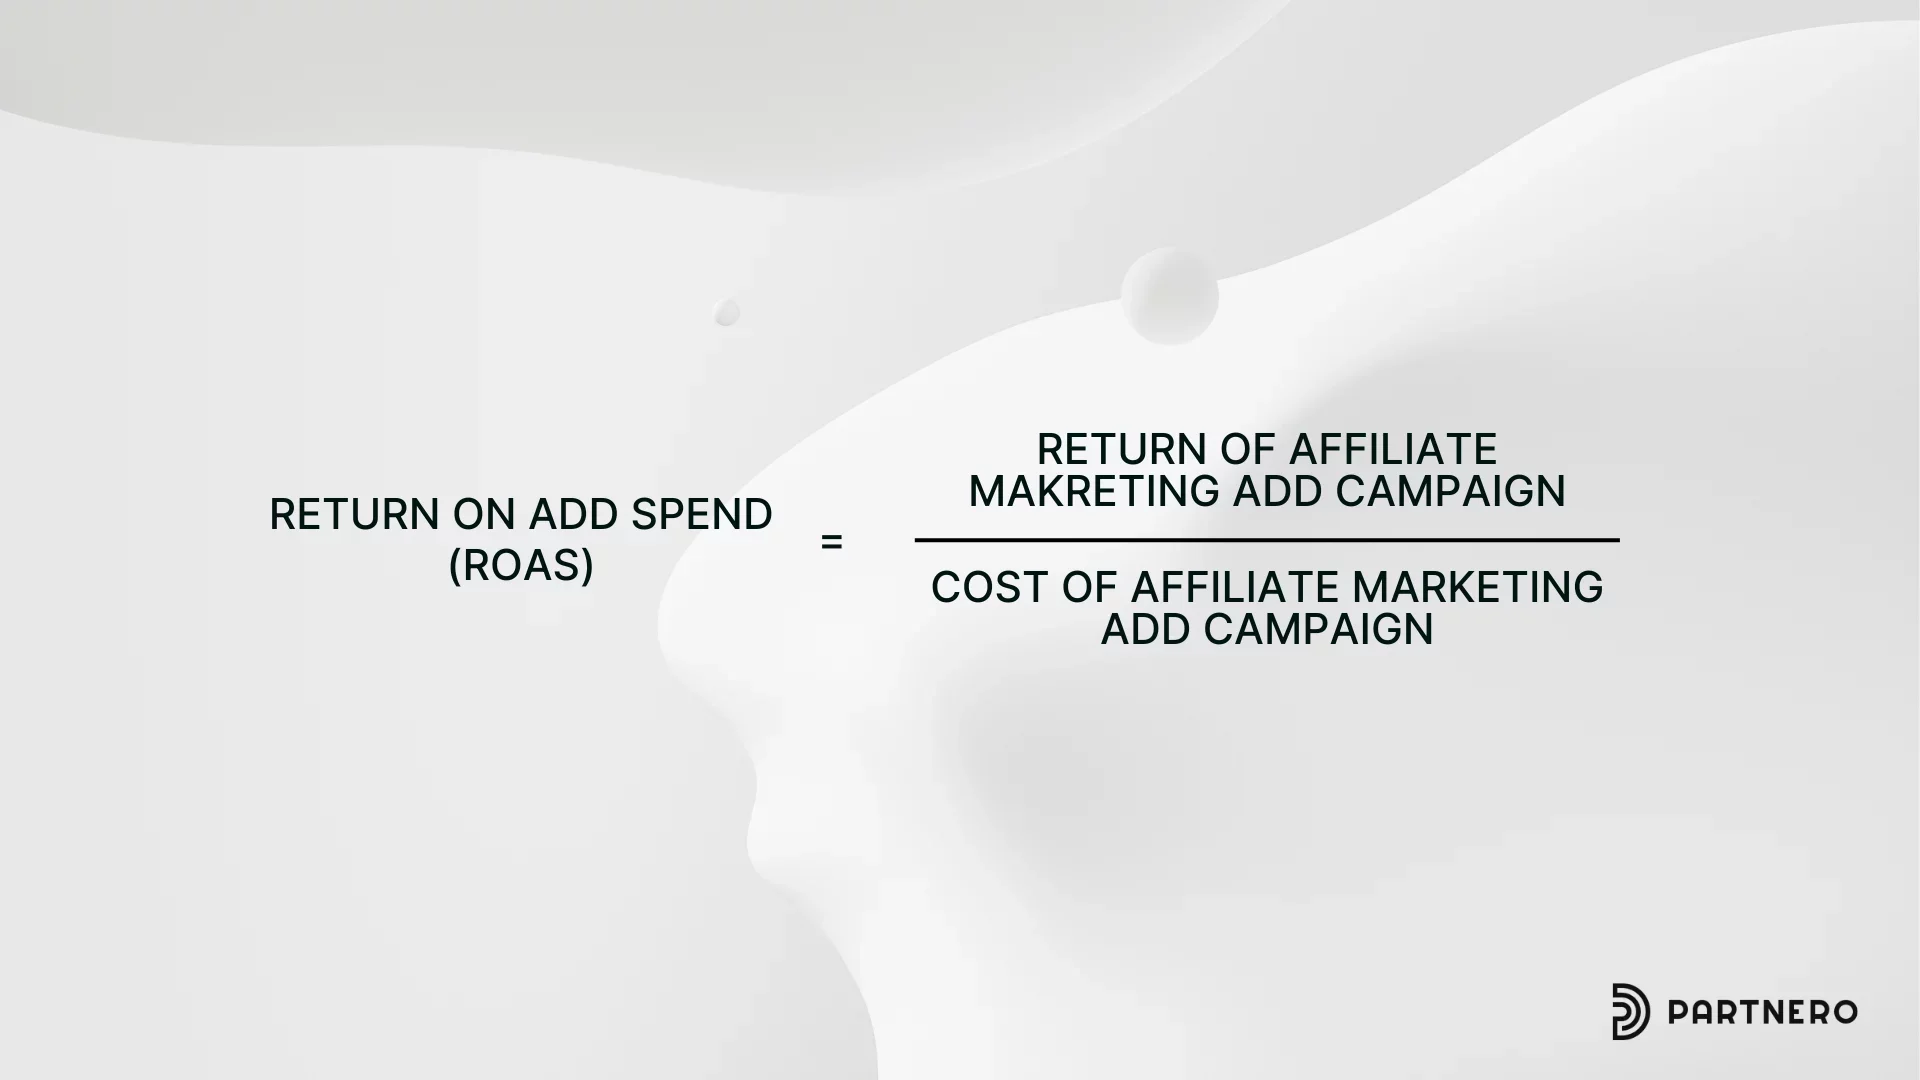
ROAS is revenue per dollar of ad spend: revenue ÷ ad spend. It applies when you or your partners run paid ads.
Benchmark: A ROAS of 2:1 to 4:1 is generally considered strong, and the e-commerce average is about 2.87:1 (Segwise). Shopify reports about 12:1 for affiliate marketing (via UpPromote, platform-reported), because you pay commission only after a sale.
Why it matters: Set the target from your margin, not from an average. Benchmark or KPI.
9. Affiliate Link Click-to-Sale Time
This is the average time between a click on an affiliate link and the purchase.
Benchmark: No cross-industry figure is published. For SaaS, a cookie window of 60–90 days is a common starting point, and B2B products often use 90–180 days (Hamster Garage).
Why it matters: It tells you how long to credit a partner and when to follow up. A window shorter than your typical buying journey penalizes content partners. More often a KPI.
10. Mobile vs. Desktop Performance
Compare clicks, conversion rate, and revenue across device types.
Benchmark: Mobile accounted for 51.51% of global page views in June 2026, versus 47.12% for desktop (StatCounter, via Vidico). Older figures near 62% are stale. Mobile drives 78% of e-commerce traffic but 66% of orders (Salesforce, Q1 2026). Desktop converts higher: 3.7% versus 2.0% for retail sites (Contentsquare).
Why it matters: Discovery often starts on a phone and closes on a desktop, so judging partners on last-device conversion can undercount mobile-heavy audiences. More often a KPI.
11. New vs. returning visitor Conversion Rate
Compare how first-time and returning visitors from affiliate links convert.
Benchmark: No dependable public benchmark exists. Because shoppers now research longer before buying, expect a growing share of conversions from returning visitors, and set your own baseline.
Why it matters: The split shows how many touchpoints your partners need to close a sale. One person on several devices can look like several visitors, so treat the numbers as directional. More often a KPI.
Partner health metrics (12–16)
12. Affiliate Program Activation Rate
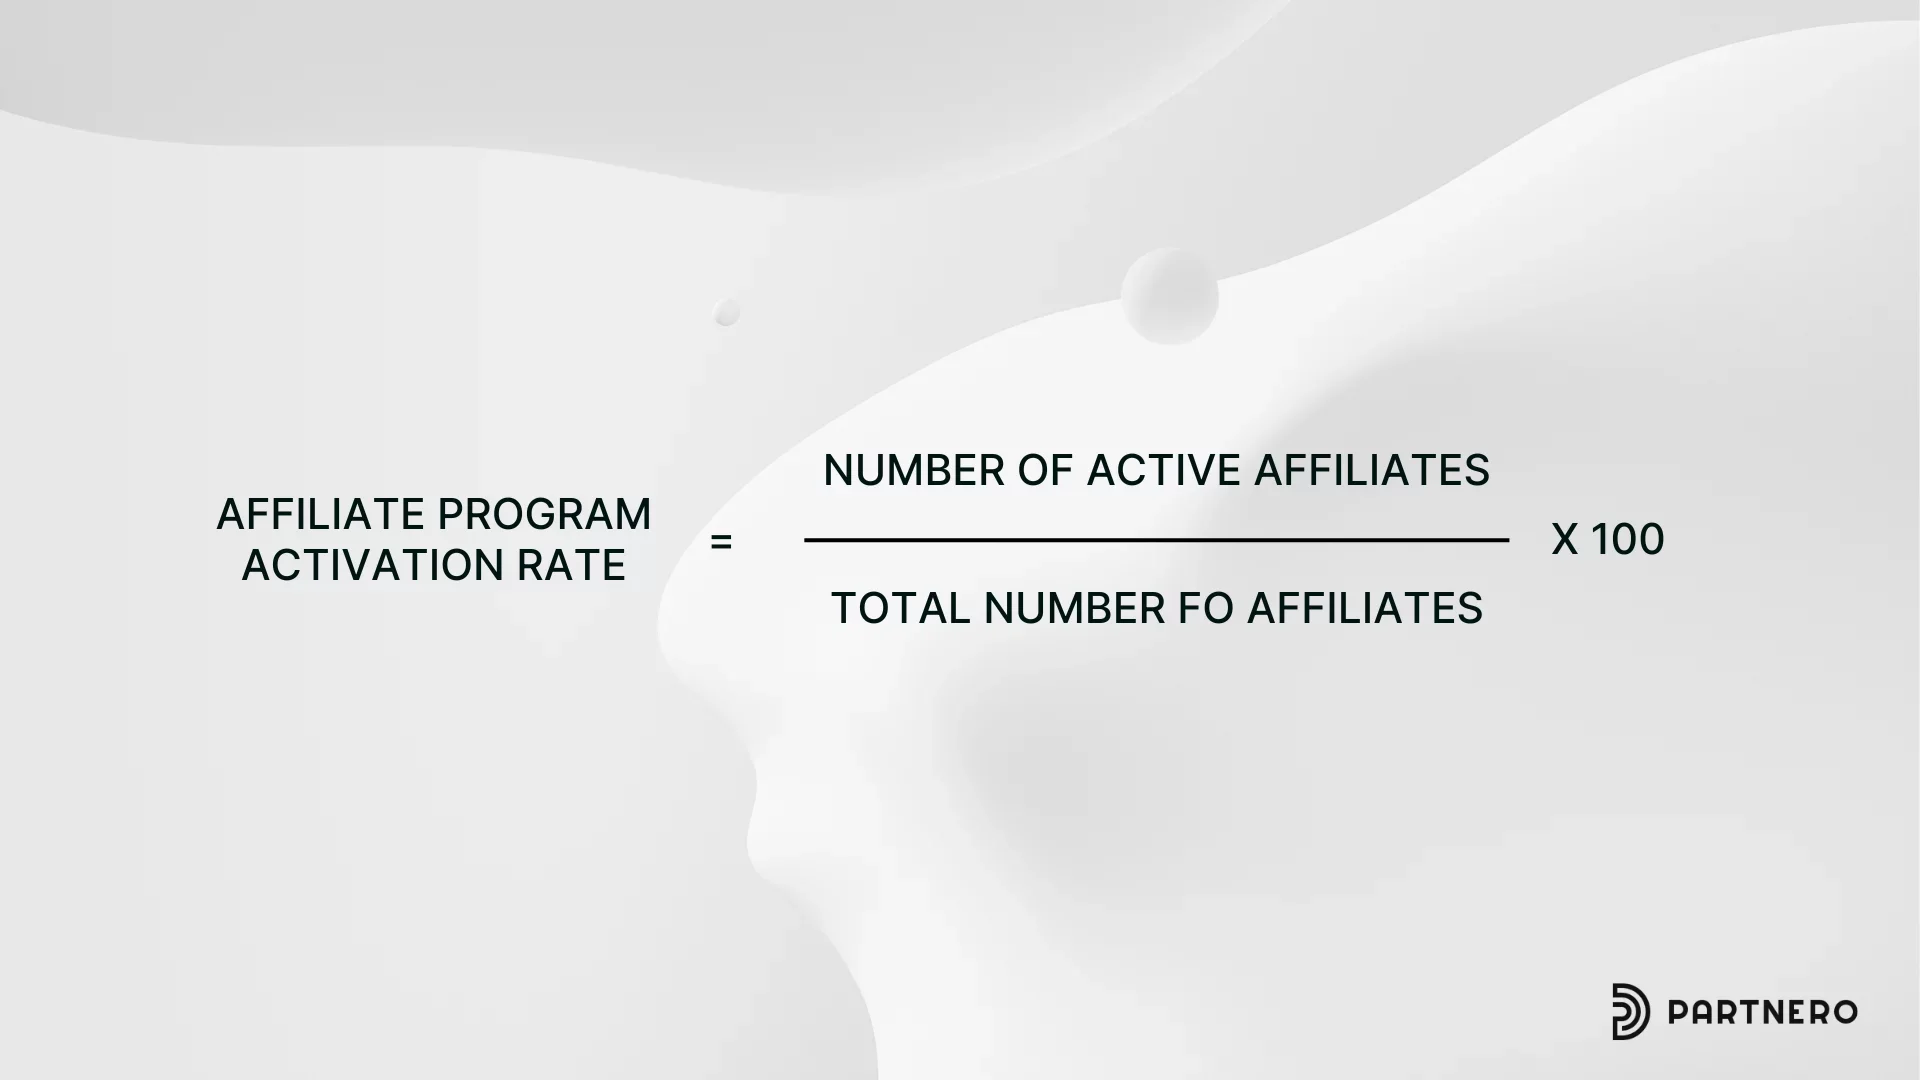
Activation rate is the share of approved affiliates who complete a defined first action within a set period: activated affiliates ÷ approved affiliates × 100. Always state the action (click, signup, sale) and the window (30 or 90 days).
Benchmark: Definitions drive the numbers, so compare like with like.
Source | Figure | Scope |
|---|---|---|
About 18% median; 31%+ top quartile | SaaS programs, at least one referral | |
7.6% generate a referral; 1.28% generate a sale | Typical SaaS program roster | |
30–45% average 30-day activation | iGaming, forex and prop trading |
Track360 also finds that partners recruited by direct outreach activate at 50–70%, against 15–25% for open registration.
Why it matters: Activation is the main bottleneck in most programs. If it is low, fix onboarding and enablement before recruiting more partners. More often a KPI.
13. Average Commission Rate
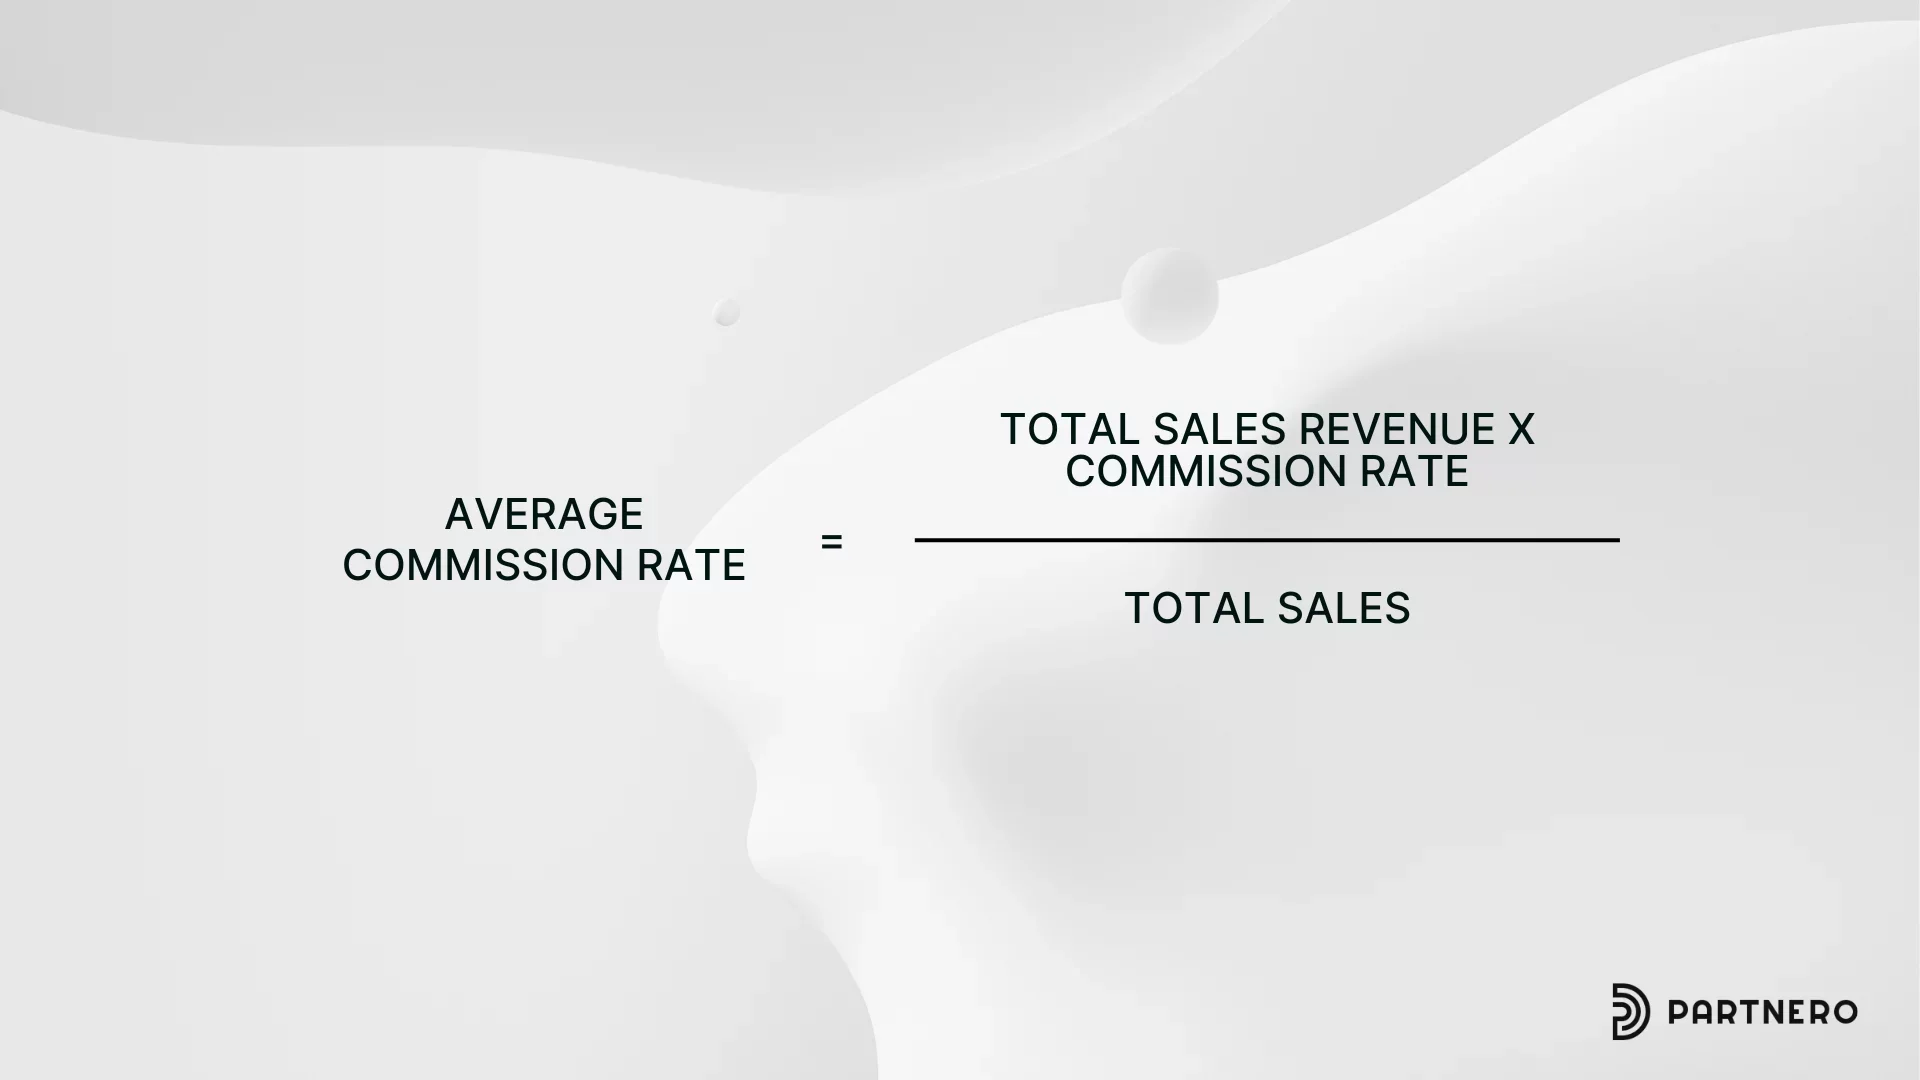
The average commission rate is the typical percentage or fixed amount paid per sale or lead.
Benchmark: SaaS programs cluster at 20–30%, with an average of 24.16% (Web Tonic, citing Rewardful). Rewardful's analysis of 2,600+ SaaS programs puts the typical rate near 30%, and some programs pay up to 40% to top partners (Rewardful). For physical goods, rates run 5–20%, fashion and beauty 8–18%, and electronics 1–10% (UpPromote, citing Post Affiliate Pro).
Why it matters: Rewardful's data shows top-performing programs were not the ones paying the most. Set the rate from your margin and customer lifetime value. Benchmark or KPI.
14. Affiliate Retention Rate
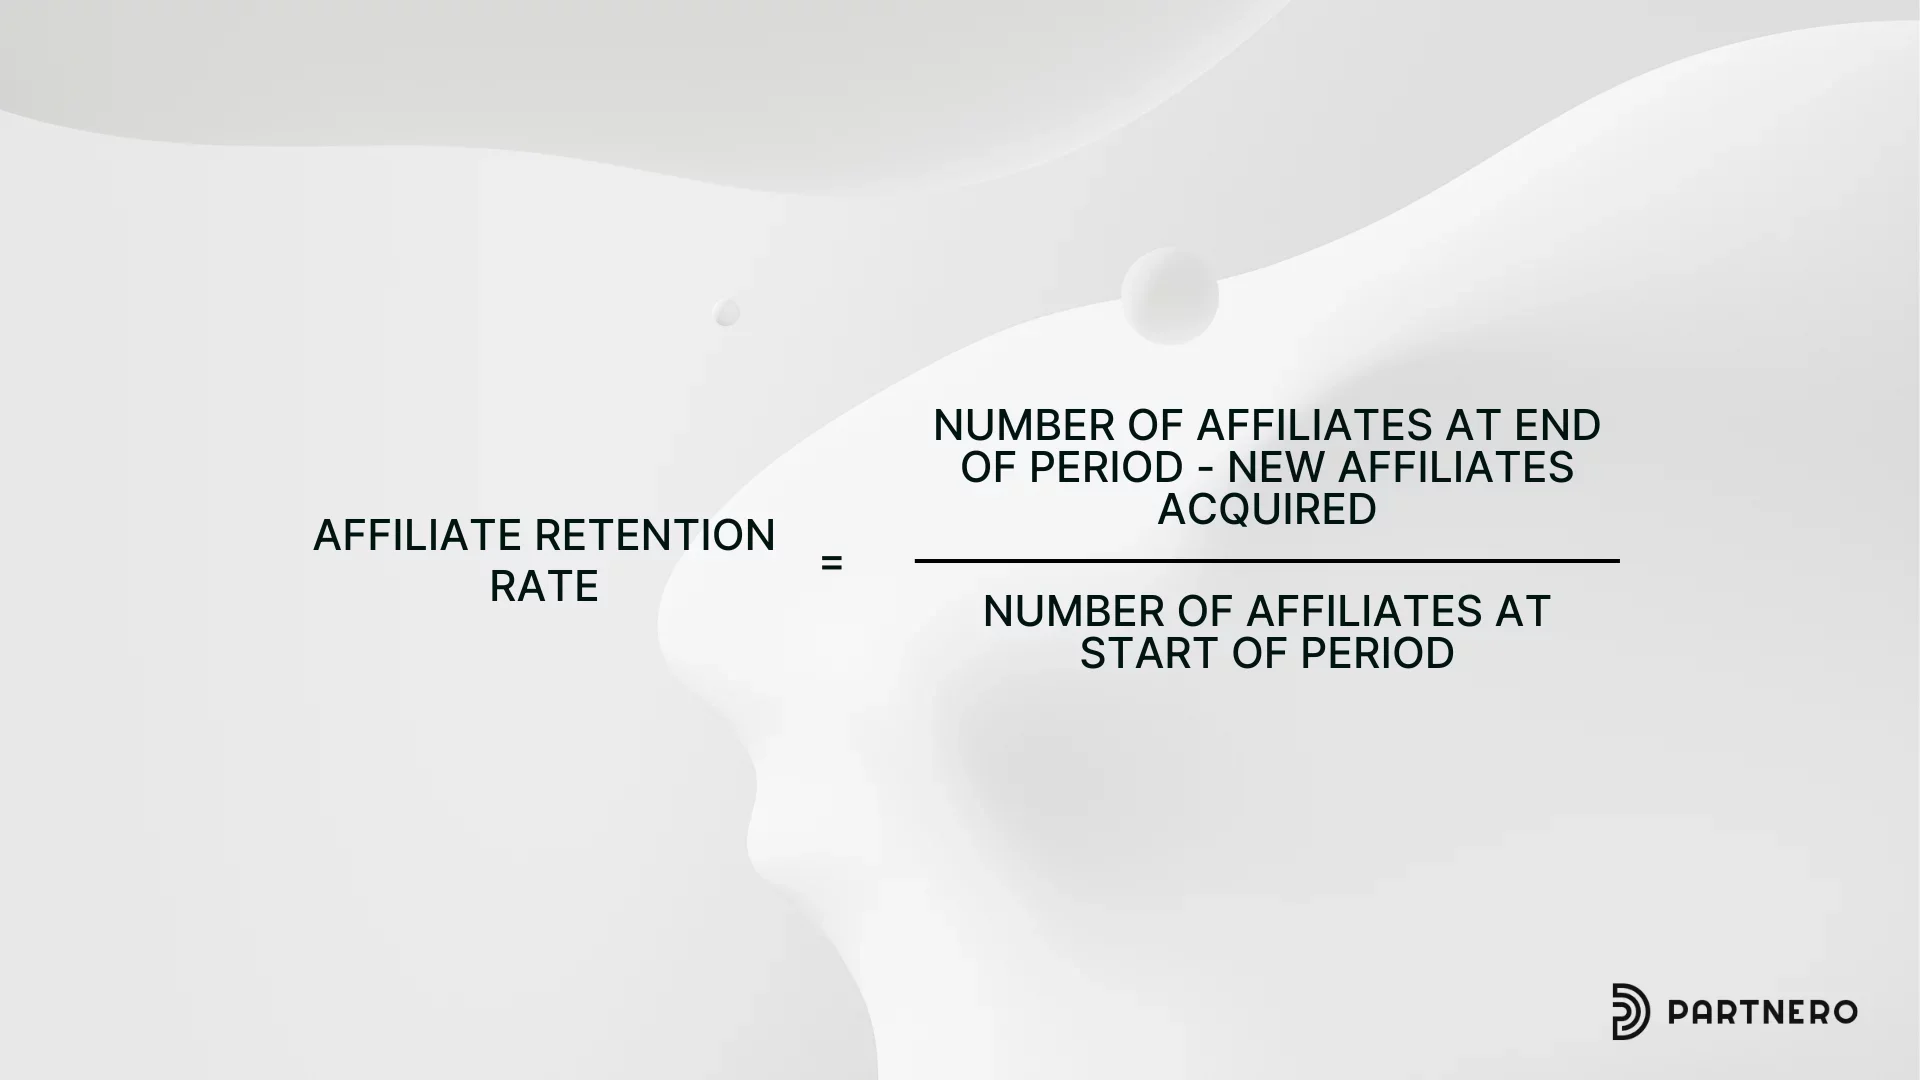
Retention rate is the share of affiliates who stay active over time. Its mirror image is churn: affiliates lost ÷ affiliates at period start × 100.
Benchmark: B2B SaaS programs see annual affiliate churn of 25–42%, which implies roughly 58–75% retention (Track360, via Hamster Garage). In iGaming, forex and prop trading, 12-month retention ranges from 40% to 70% (Track360). Revenue is concentrated: the top 5–10% of SaaS affiliates generate 80–90% of program revenue (Hamster Garage, citing Rewardful).
Why it matters: Losing a few top partners can hurt more than losing many small ones, so track retention by tier. More often a KPI.
15. Traffic Source Distribution
This breaks down where affiliate traffic and sales come from: content, email, social, loyalty sites and networks.
Benchmark: Roughly half of affiliate visits come from organic search, according to Authority Hacker data (via iREV). Impact.com's H1 2026 data shows how partner types differ (via Web Tonic):
- Network partners account for 50% of clicks.
- Content and review partners take 26% of brand spend.
- Loyalty and rewards partners drive 55% of transactions.
Why it matters: Different partner types do different jobs, from research to closing the sale. Credit only the last click and you undervalue the first two. More often a KPI.
16. Affiliate content and link placement performance
This tracks which content formats (reviews, comparisons, tutorials) and link placements (in-text, banners, widgets) generate clicks and conversions.
Benchmark: No reliable public benchmark exists, because results depend on niche and audience. Compare your own partners' links and referrers instead.
Why it matters: Knowing which formats and links convert tells you what to ask partners for and what to replicate. More often a KPI.
Value, risk and growth metrics (17–21)
17. Customer Lifetime Value (CLV)
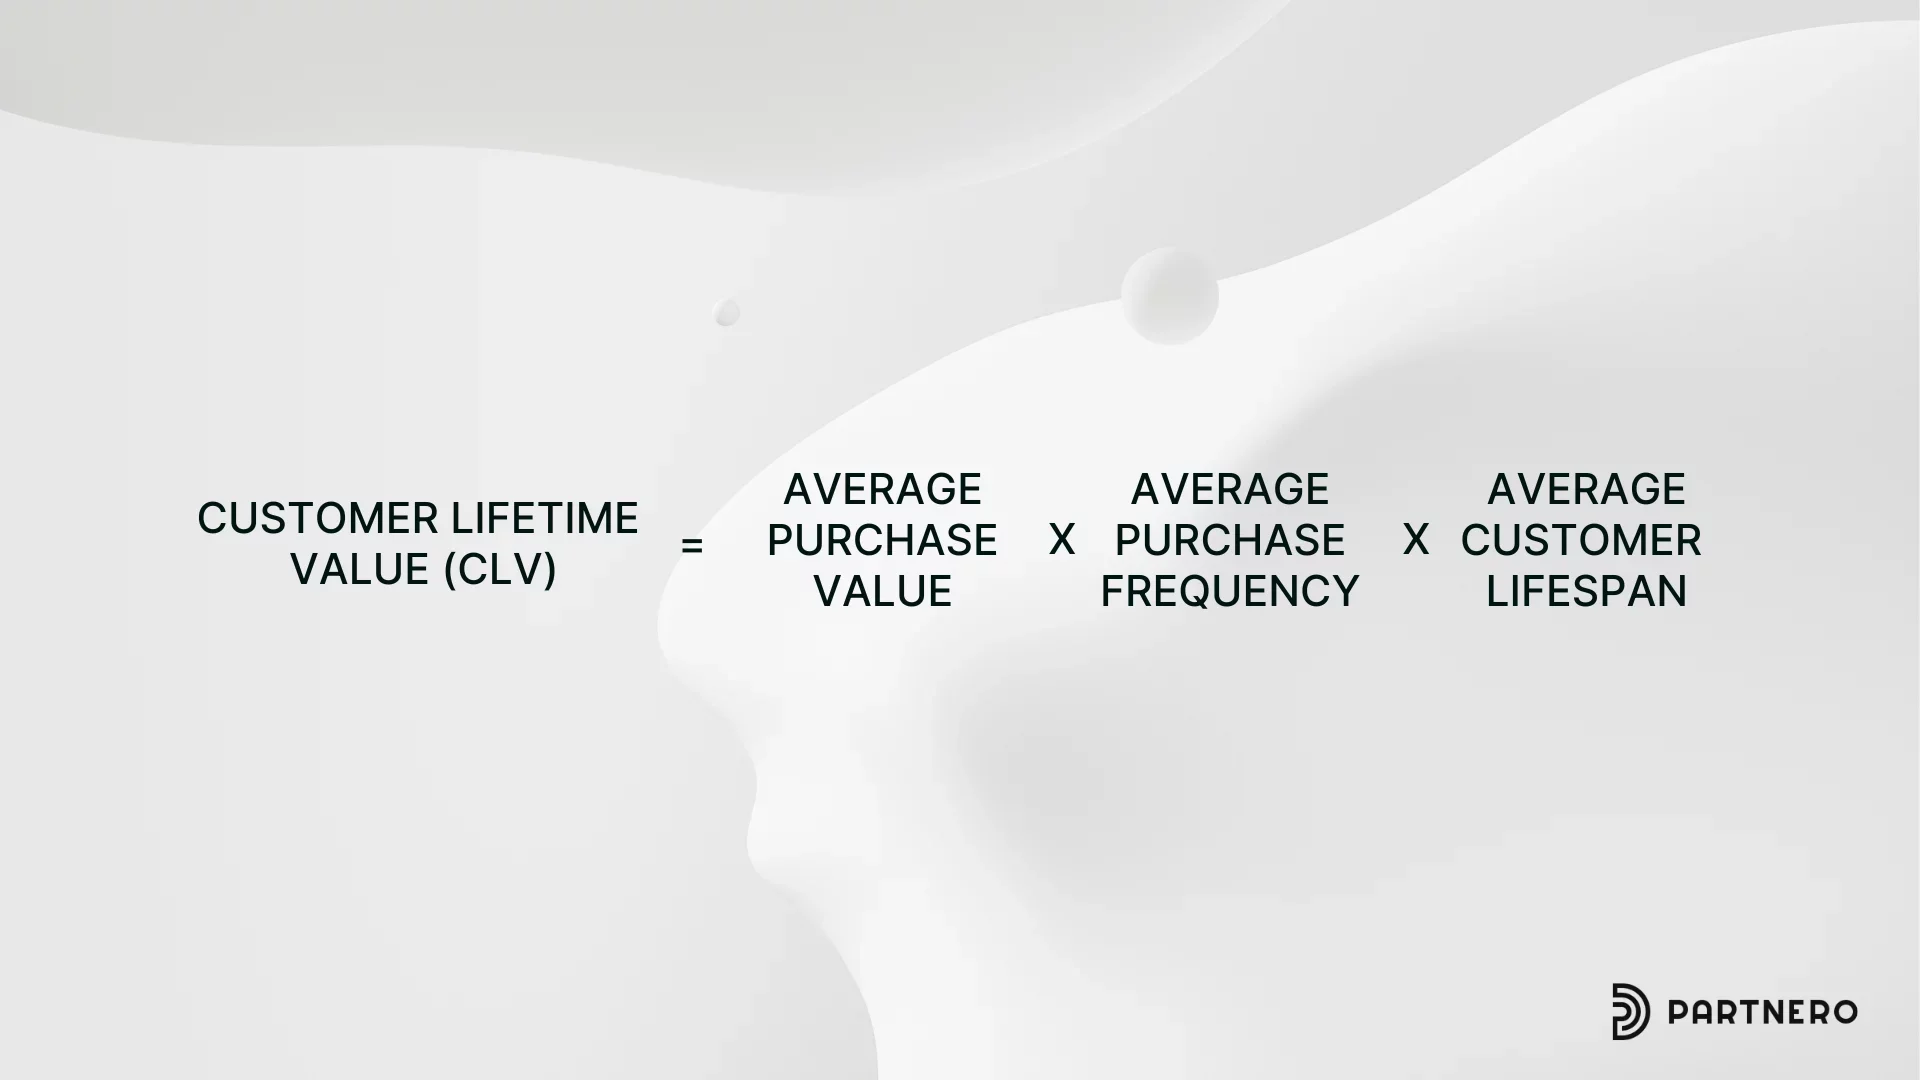
CLV estimates the total revenue a customer generates over the relationship. For SaaS, a simple version is average monthly revenue per account ÷ monthly churn.
Benchmark: A lifetime value of at least 3× acquisition cost is the standard planning reference. B2B SaaS affiliate programs report LTV:CAC ratios of 4.2×–9.5× (Track360, via Hamster Garage, vendor-reported).
Why it matters: CLV caps what you can afford to pay per customer, and it decides whether recurring commissions are sustainable. More often a KPI.
18. Affiliate Engagement Rate
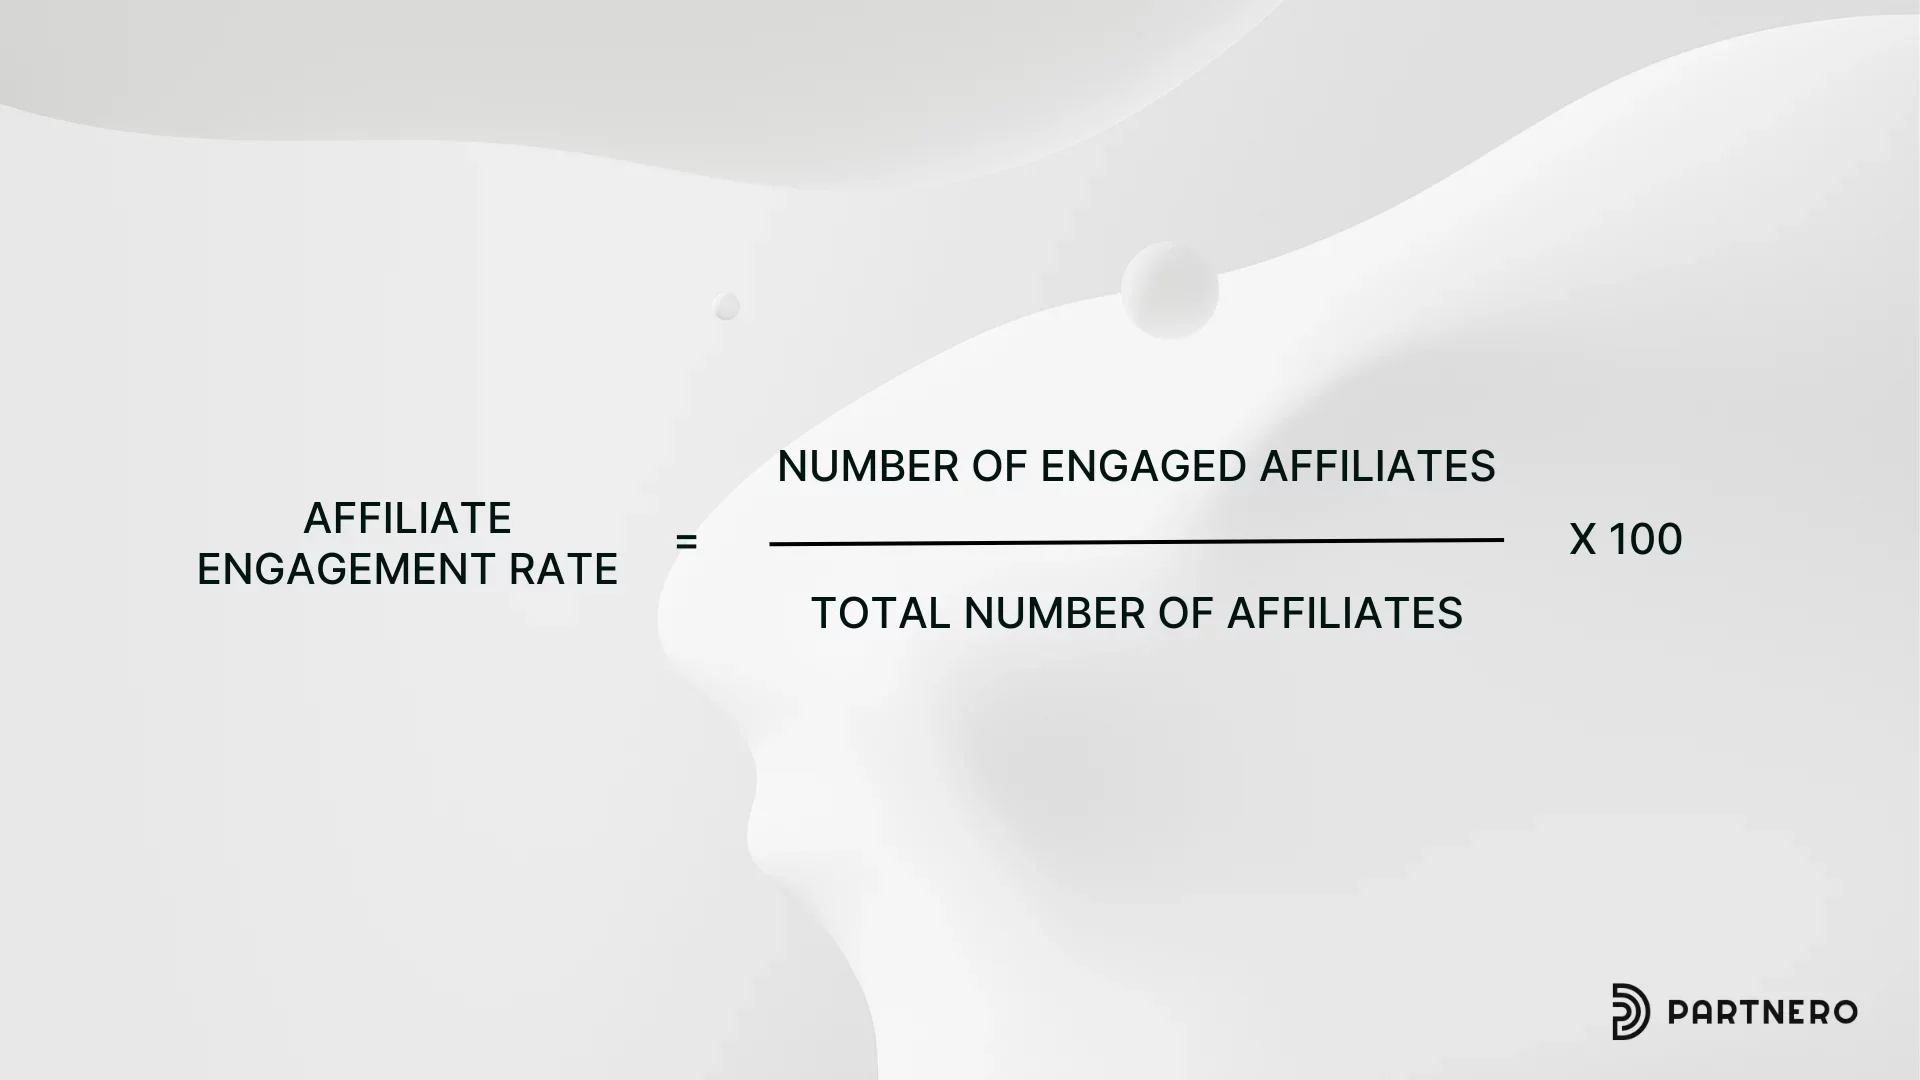
Engagement rate measures how actively partners use the program: logging in, sending traffic, using assets or joining promotions.
Benchmark: The clearest published measure is the active partner ratio, the share of registered affiliates who sent at least one click in the past 30 days. A healthy ratio is 25–40%, below 15% points to onboarding or fit problems, and above 50% is usually a small, curated program (Track360).
Why it matters: Engagement is a leading indicator. A falling ratio over six months is a stronger warning than any single month's number. More often a KPI.
19. Affiliate Fraud Rate
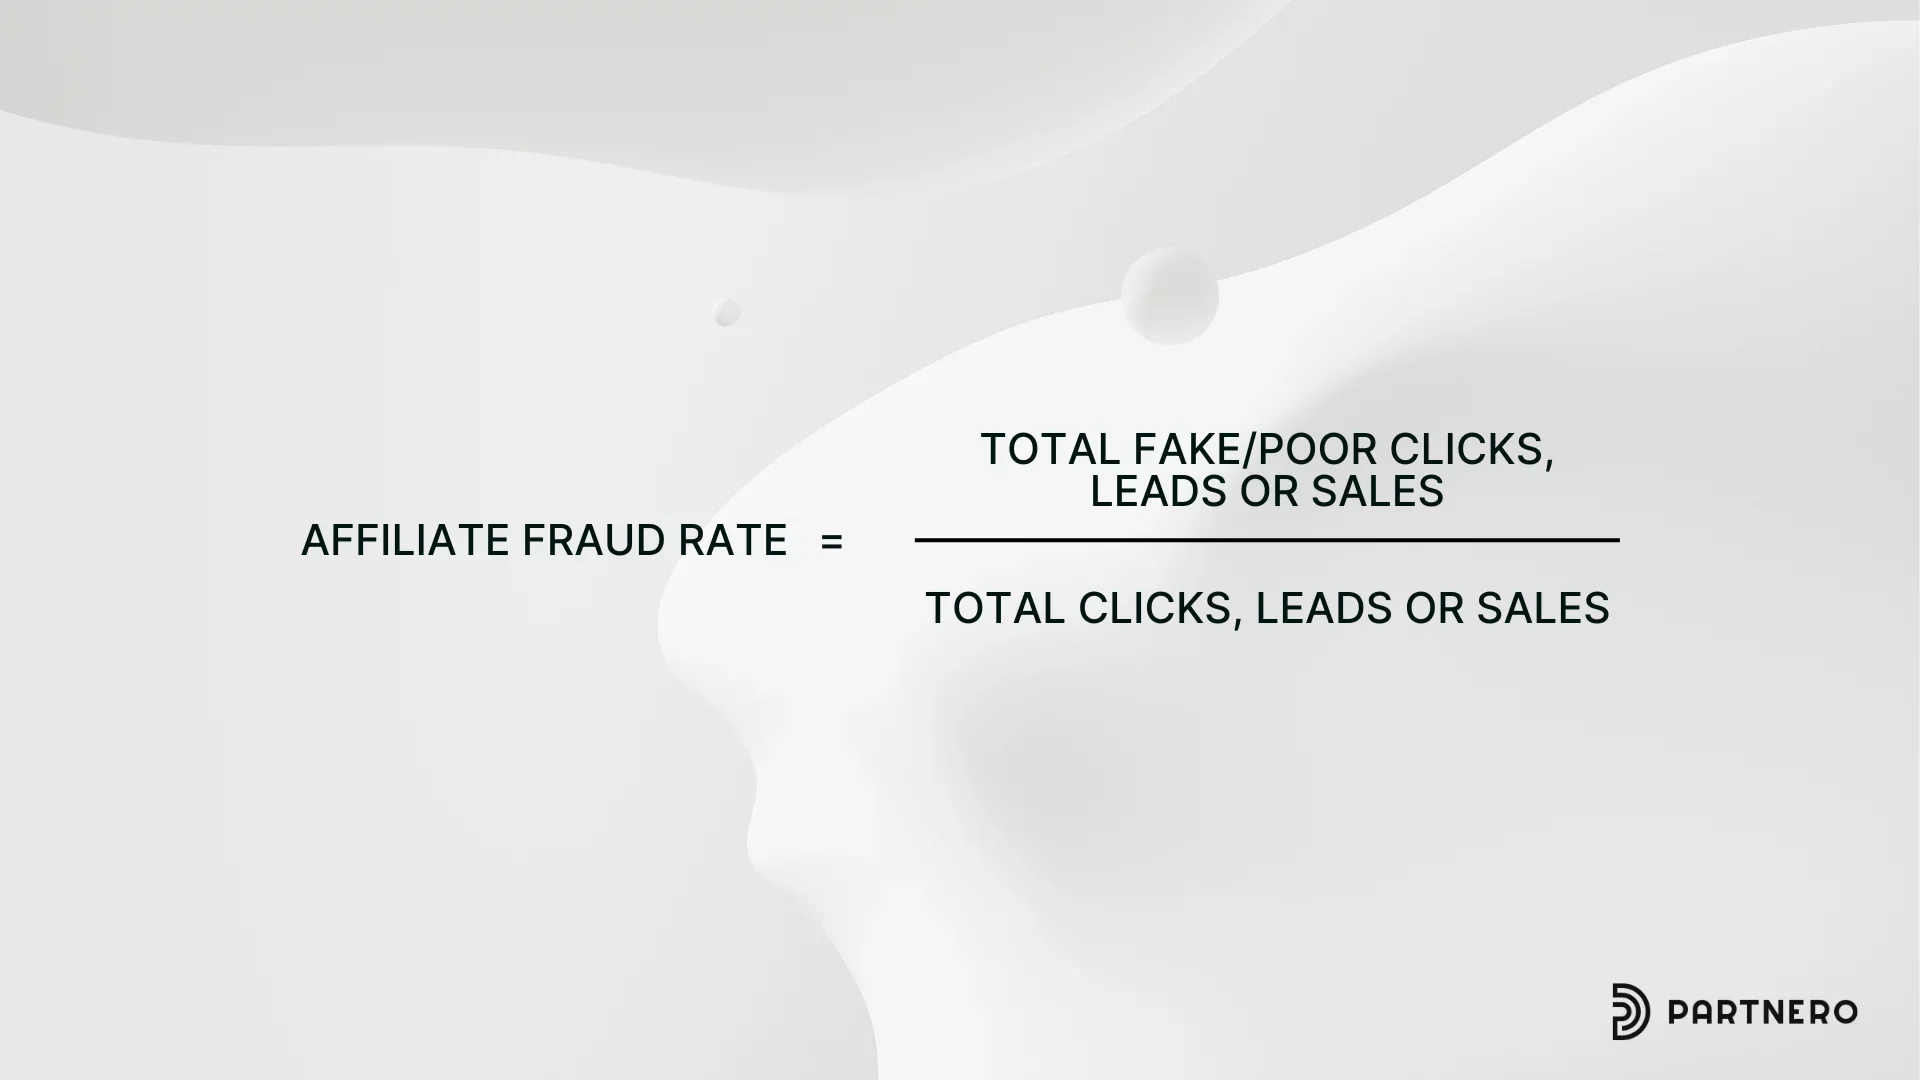
Fraud rate is the share of clicks, leads or conversions that are invalid or fraudulent.
Benchmark: Fraudlogix analyzed 105.7 billion ad impressions in 2025 and found a 20.64% global invalid traffic rate. Desktop had the highest rate at 27.03% (Fraudlogix). Those figures cover advertising broadly, and affiliate channels are especially exposed because payouts per action are higher. An older affiliate-specific estimate puts fraudulent affiliate traffic at around 17% (UpPromote, citing CHEQ, 2022). Set your own target from your baseline and watch the trend.
Why it matters: Fraud inflates payouts and corrupts the data you use to decide where to invest. Holding commissions through a review period before they become payable is a common safeguard. More often a KPI.
20. Affiliate Program Growth
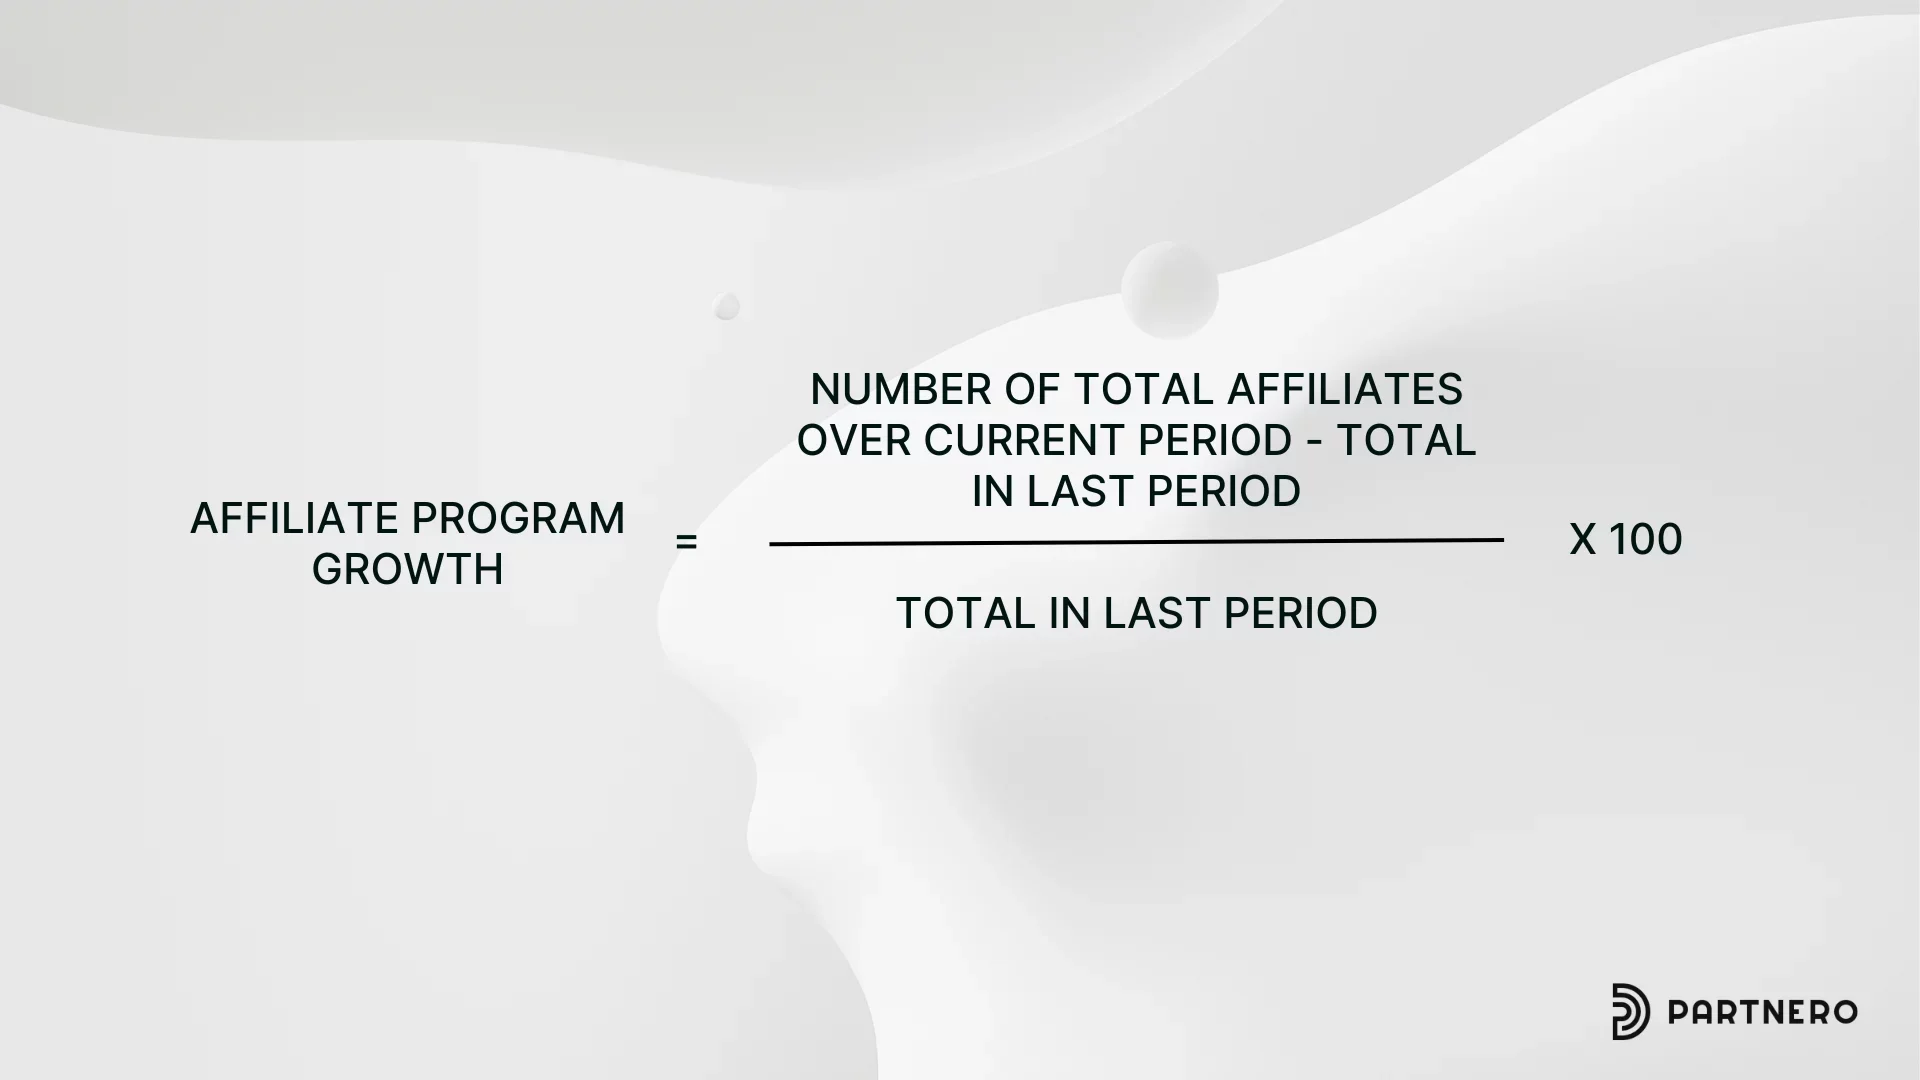
Program growth counts how many new, active partners join and how fast their results grow: new partners per period and revenue per partner cohort.
Benchmark: At channel level, US affiliate spend was $13.62 billion in 2024 (Performance Marketing Association) and grew 49.8% from 2021 to 2024. eMarketer projects it above $13 billion in 2026 (iREV). At program level, 56% of programs have fewer than 50 affiliates and only 10% pass 1,000 (Web Tonic, citing Rewardful). Only 15.6% of SaaS programs stay active long term, mostly because of neglect rather than poor economics (Hamster Garage).
Why it matters: Growth in partner quality matters more than headcount. Early programs should watch activation and time to first conversion. More often a KPI.
21. Return on Investment (ROI)
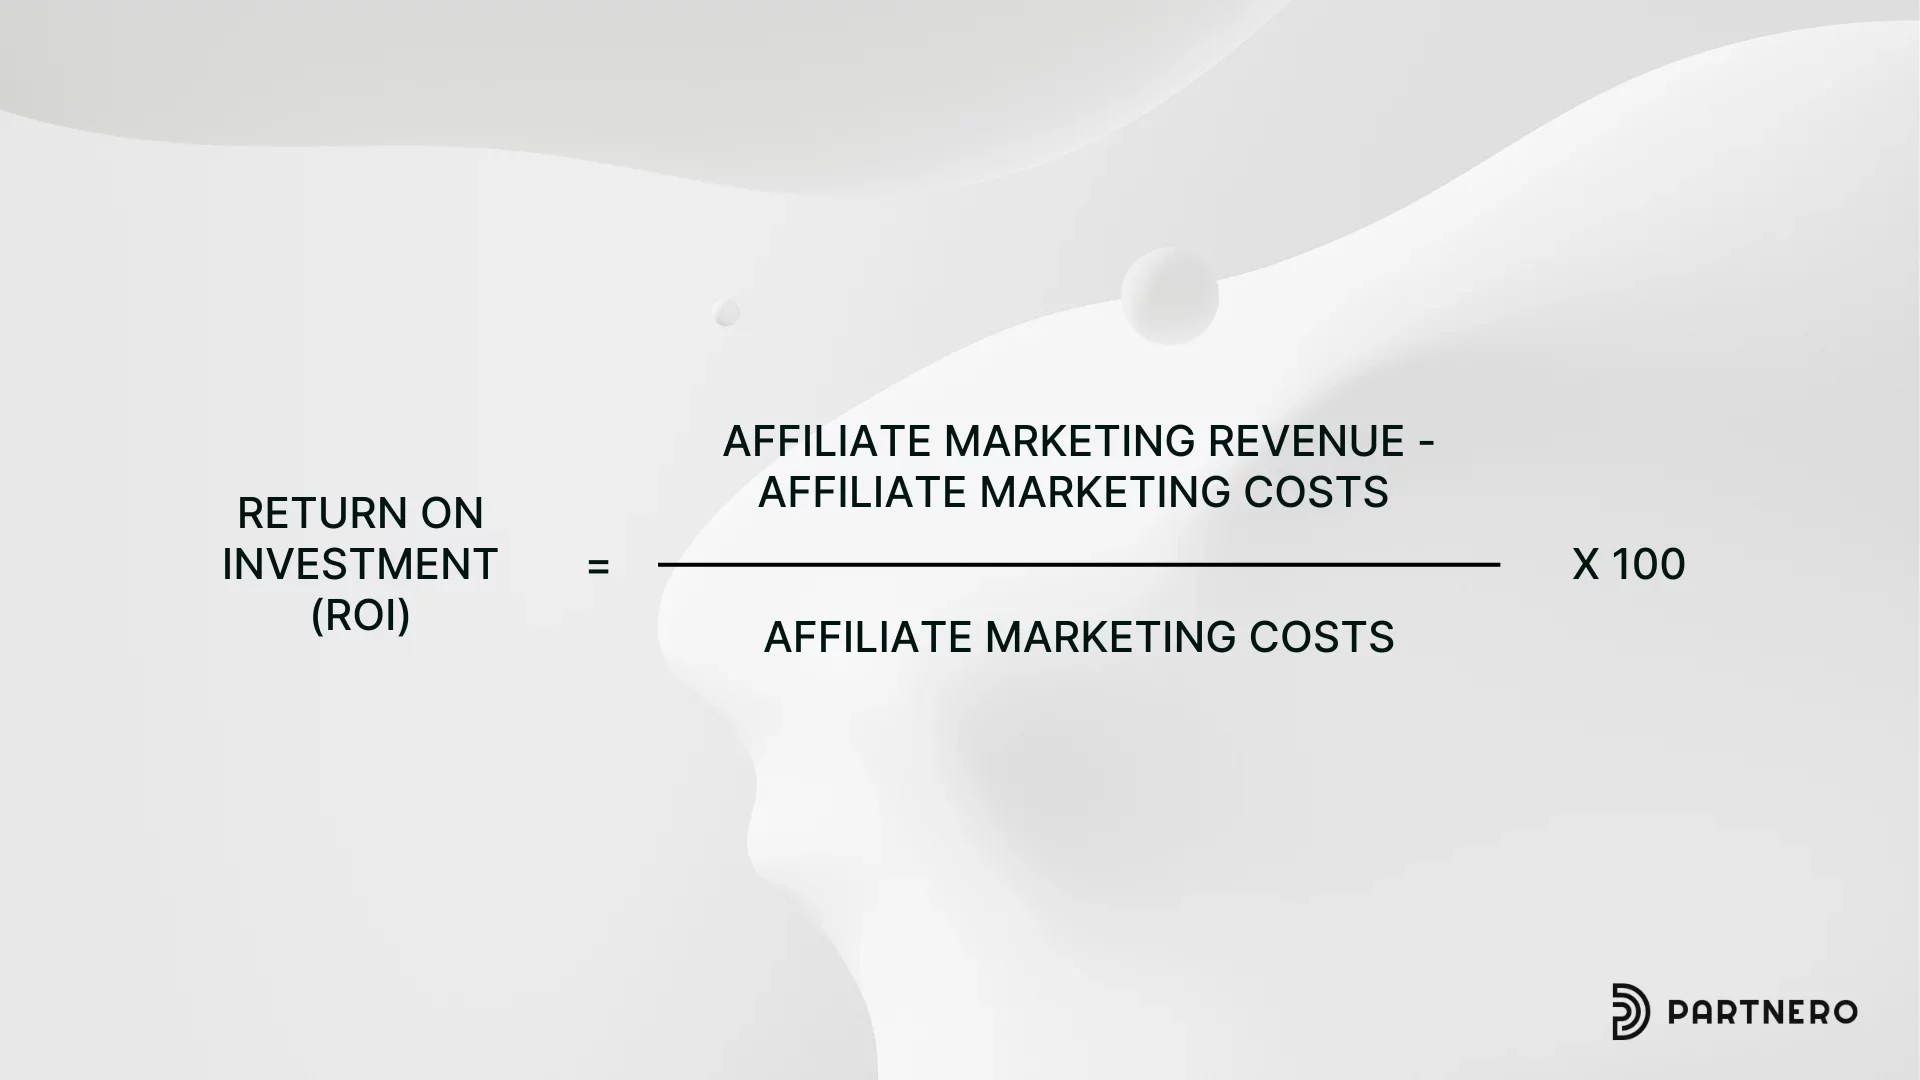
Affiliate ROI is profit relative to program cost: (affiliate revenue − total program costs) ÷ total program costs. Costs include commissions, software, network fees and management time.
Benchmark: The average program returns about $6.50 per $1 spent, and top programs reach $12–$15 (Matt McWilliams). iREV cites an average near $12 with a range of $6.50–$15 (via Rakuten). In an IAB Australia survey, 87% of advertisers were satisfied with affiliate ROI, against 71% for retail media (via Web Tonic).
Why it matters: ROI shows whether the channel deserves more budget. Use margin, not revenue, to judge it. More often a KPI.
Extra: seasonal and top-performing industries
This isn't a single metric, but industry and season explain much of the variation in every benchmark above.
Industry | Indicative benchmark | Source |
|---|---|---|
SaaS and AI tools | 20–30% recurring commission | |
Finance and fintech | $50–$300 per verified signup | |
Education and e-learning | About $15,551 average monthly publisher earnings | iREV, citing Authority Hacker and others |
Travel | About $13,847 average monthly publisher earnings | iREV |
Beauty | About $12,476 average monthly publisher earnings | iREV |
Physical goods | 5–20% commission |
Seasonality: Peak periods bring traffic that does not always convert. During Cyber 5, Partnerize recorded clicks up 31% while purchase completion fell 26% (via iREV). Mobile's share of US online spend reached 56.4% over the 2025 holiday season and peaked at 66.5% on Christmas Day (Adobe, via Vidico).
Why it matters: Compare your results with your own industry and the same period last year, not with a cross-industry average.
Track these KPIs in Partnero
Partnero's analytics cover most of the metrics in this guide across a set of reports, from click-level data to partner cohorts and payouts. Open your program, go to Analytics, and switch between the tabs below. The analytics overview in the knowledge base lists every report.
Metric in this guide | Where to find it | What you see |
|---|---|---|
Conversion rate (2), ROI (21) | Program revenue, net profit, clicks, signups, paid customers, click-to-signup and signup-to-sale conversion | |
Trends over time (2, 20) | Any date range grouped by day, week or month, with period comparison, partner-tag filters and export | |
CPA (6), commission rate (13) | Reward cost per paid customer and reward share of revenue | |
Activation (12), engagement (18), growth (20) | Share of partners with signups and paid customers, cohorts by sign-up month, median days to first sale, top partners | |
CLV (17) | Purchases per customer, repeat purchase rate, average purchases per paid customer by cohort | |
Link and content performance (16) | Clicks, signups and conversion rate per link, by link type and partner | |
Device and traffic source (10, 15), fraud (19) | Referrer, device, browser and OS for every click, with export for fraud review | |
CPL (7) | Submitted and converted leads, lead-to-customer rate, revenue per lead, time to conversion | |
Payout health | Cash position, days to pay, unclaimed balance by age, and a dependency-risk flag when one partner takes 70% or more of payouts | |
Reward status and fraud flags | Every reward with status, including fraudulent and rejected, filterable and exportable as CSV |
A practical starting set: Track activation and median days to first sale in Partner performance, click-to-signup and signup-to-sale in the Performance report, and reward share of revenue in the overview. Review them monthly against the benchmarks above.
Measure your success and grow with Partnero
Mastering these affiliate marketing KPIs, benchmarks, and metrics is essential for driving success in your affiliate programs. By regularly monitoring and analyzing these metrics, you can make data-driven decisions to optimize your strategies, improve performance, and maximize your return on investment.
By focusing on these key metrics and working to improve them over time, you'll be well-positioned to build a thriving affiliate marketing program that delivers value to your business, your affiliates, and your customers alike.
Remember, while these benchmarks provide useful guidelines, every affiliate program is unique. It's important to establish your baseline metrics and continuously strive for improvement. Regularly review your performance, test new approaches, and stay adaptable in the ever-evolving landscape of affiliate marketing.
See how it works in the analytics and performance feature overview, or start a free trial to explore the reports with your own program data.
Frequently asked questions
Affiliate traffic typically converts at 1–3%, with top programs near 5%. For SaaS, expect 3–7% from click to trial and 1–3% from click to paid, and about 0.8% for direct referral-to-sale. Conversion rates fell 12% year on year in H1 2026 as shoppers researched longer before buying.
Most SaaS programs pay 20–30% recurring, with an average of 24.16%. Physical-goods programs pay 5–20%, and finance programs often pay a flat $50–$200 per acquisition. Set the rate from your gross margin and customer lifetime value, not from competitors' headline rates.
The median SaaS program activates about 18% of approved partners, and top-quartile programs reach 31% or more. Programs that recruit by direct outreach activate far more partners than those relying on open sign-up. Define activation and the time window before you compare.
Fraudlogix measured a 20.64% invalid traffic rate across 105.7 billion ad impressions in 2025, with desktop highest at 27.03%. An older affiliate-specific estimate is about 17%. Your own rate depends on your partners, so monitor click data and hold commissions through a review period.
The average program returns about $6.50 per $1 spent, and well-run programs reach $12–$15. ROI should include commissions, software, network fees and management time, and be judged against margin.
Desktop typically converts better, even though mobile now carries about half of global page views. Mobile drives 78% of e-commerce traffic but 66% of orders, so partners can start journeys on mobile that finish on desktop.
Start with partner activation, time to first conversion, click-to-signup rate and signup-to-sale rate. Add reward share of revenue and ROI once you have enough data, and watch fraud and revenue concentration as the program grows.
Launch your program in minutes or get in touch for advanced setups.
Fast setup & easy migration
Connect Partnero to your tools, with support if you’re switching platforms.Automated, transparent payouts
Pay partners on schedule and save hours. No spreadsheets or manual errors.
Affiliate and referral program software trusted by 1,500+ businesses. Connect with Stripe, Paddle, Shopify and more.


Product updates, affiliate marketing tips, and growth insights.