21 Essential Affiliate Marketing Benchmarks & KPIs for Success in 2026

Affiliate marketing is a powerful business strategy for expanding reach–lead generation has never been more important. So, how do we measure affiliate marketing success? What affiliate marketing benchmarks or key performance indicators (KPIs) should we hold ourselves accountable to?
This comprehensive guide will explore over 21 essential affiliate marketing metrics every marketer should monitor and how they stack up against industry benchmarks. Digital marketing is also a big part of this, so the metrics we’ll discuss can also measure your digital marketing success.
We'll explain what these metrics mean, why they're important, and how you can use them to optimize your affiliate marketing campaigns for your target audience. Whether new to affiliate marketing or looking to refine your strategy, these benchmarks and KPIs will help your partnerships succeed.
From ads to the search engine (and hey, how can automation fit into all of this?), here are some valuable insights on measuring affiliate marketing success, identifying your top affiliates, and reducing churn. Let’s measure and improve your affiliate network performance.
What is the sifference between benchmarks, KPIs, and metrics?
KPIs? Benchmarks? Metrics? What’s the difference?!
It's worth noting that KPIs and benchmarks can be complementary. You can use benchmarks to help set targets for your KPIs and use your KPIs as the metrics you choose to benchmark against other companies or industry standards.
Additionally, here are some key relationships to keep in mind:
KPIs are metrics, but not all metrics are KPIs.
Benchmarks can be used to set targets for KPIs.
KPIs can be used as the metrics you choose to benchmark against other companies.
Metrics provide the data points that can be used in KPIs and benchmarking.
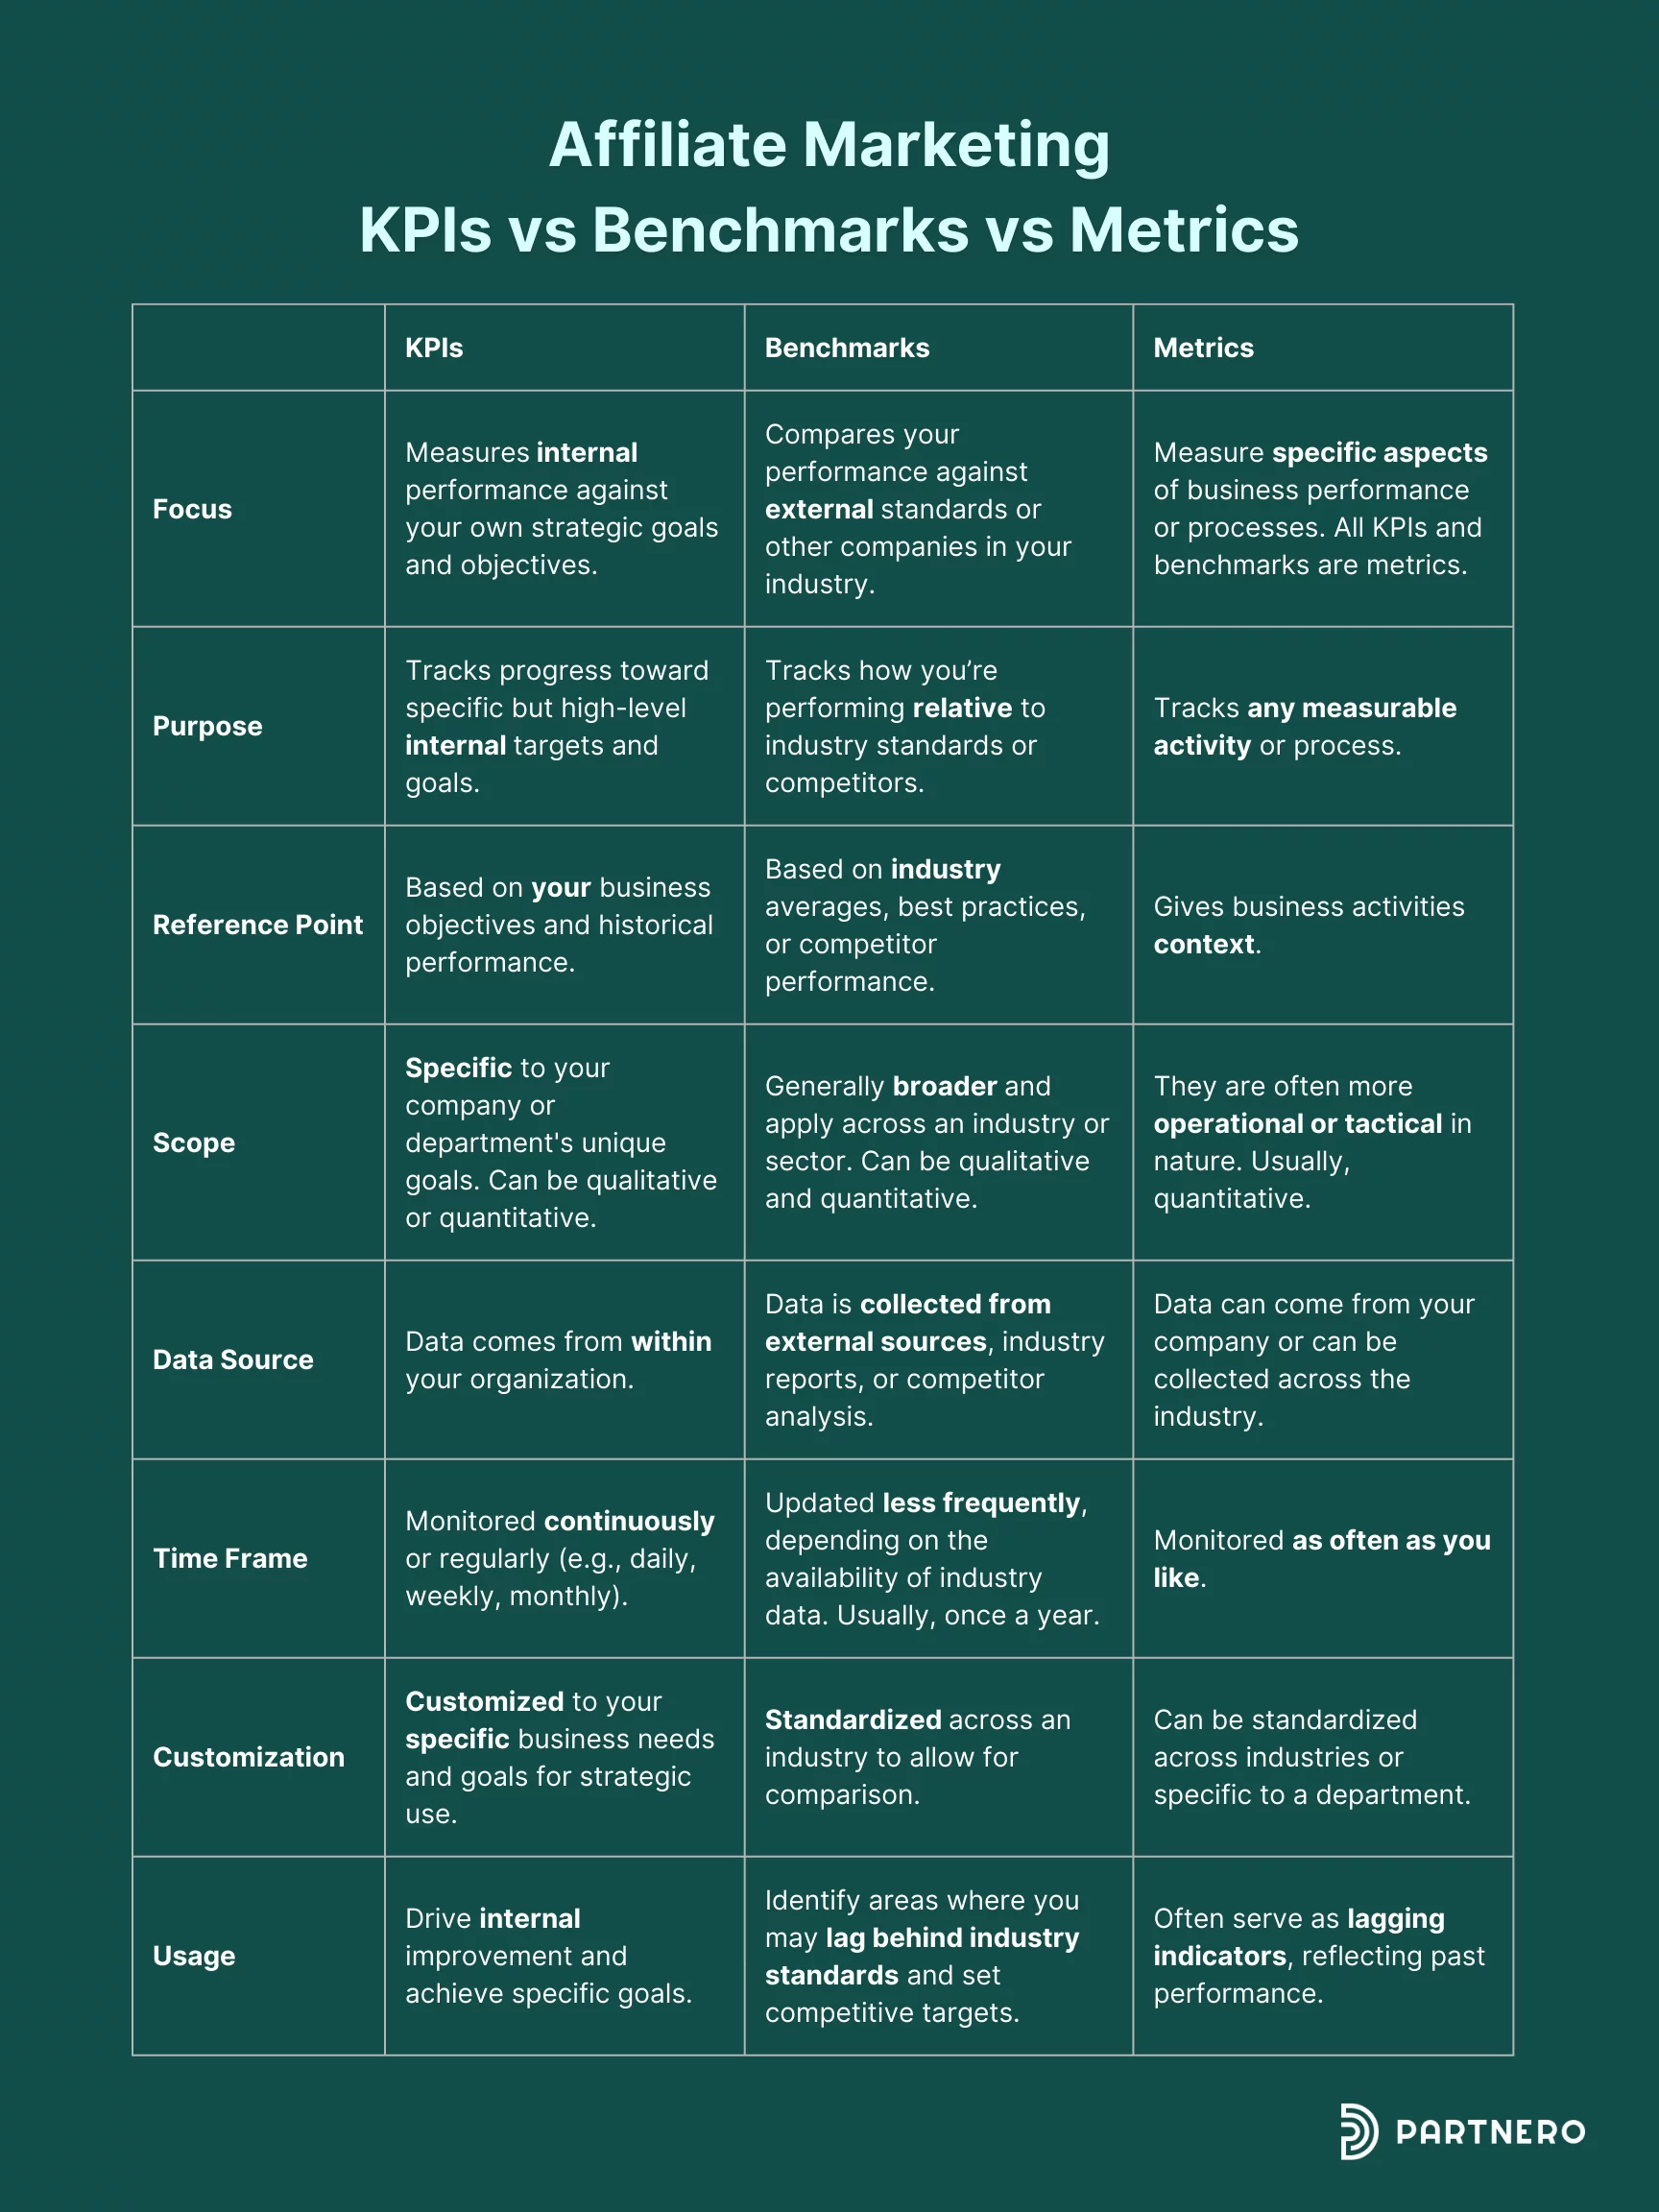
In summary:
KPIs are strategic indicators tied to specific business goals.
Benchmarks are comparative measures against external standards.
Metrics are broader measurements of any business activity or process.
Essential affiliate marketing metrics to measure success
No matter what your goals are in affiliate marketing–brand awareness, lead generation, or increased sales, it’s important to monitor and measure your progress in a given period. Here are some metrics to set as KPIs or benchmark your affiliate marketing progress against.
1. Click-Through Rate (CTR)
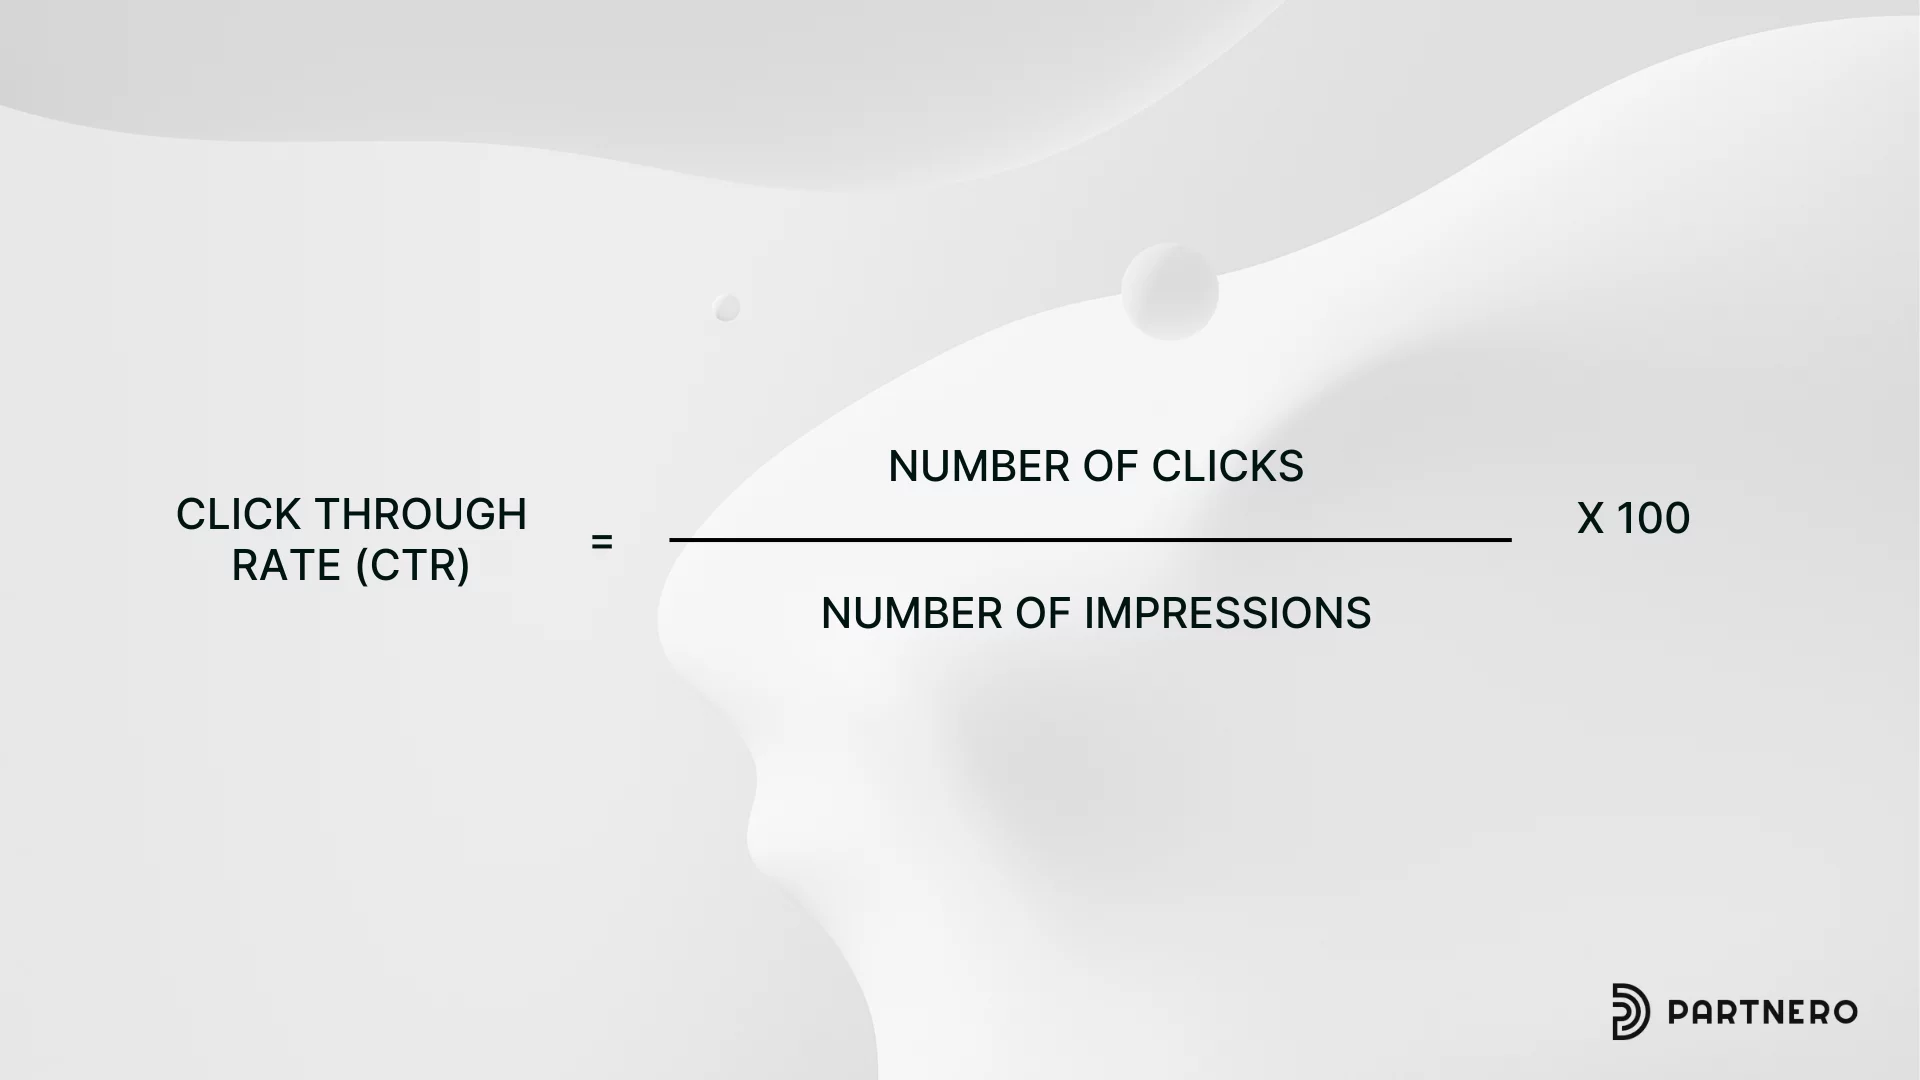
Click-through rate is an important and fundamental metric that measures the percentage of people who click on your affiliate link after viewing it.
CTR benchmark for affiliate marketing
A good CTR can vary by industry, even in affiliate marketing, but generally, a rate between 0.5% and 1% is considered average. Anything above 1% is excellent.
Why it matters: CTR indicates how effectively your affiliate content attracts potential customers. A high CTR suggests that your content resonates with your audience and encourages them to take action. This metric can be a benchmark or KPI.
2. Conversion Rate
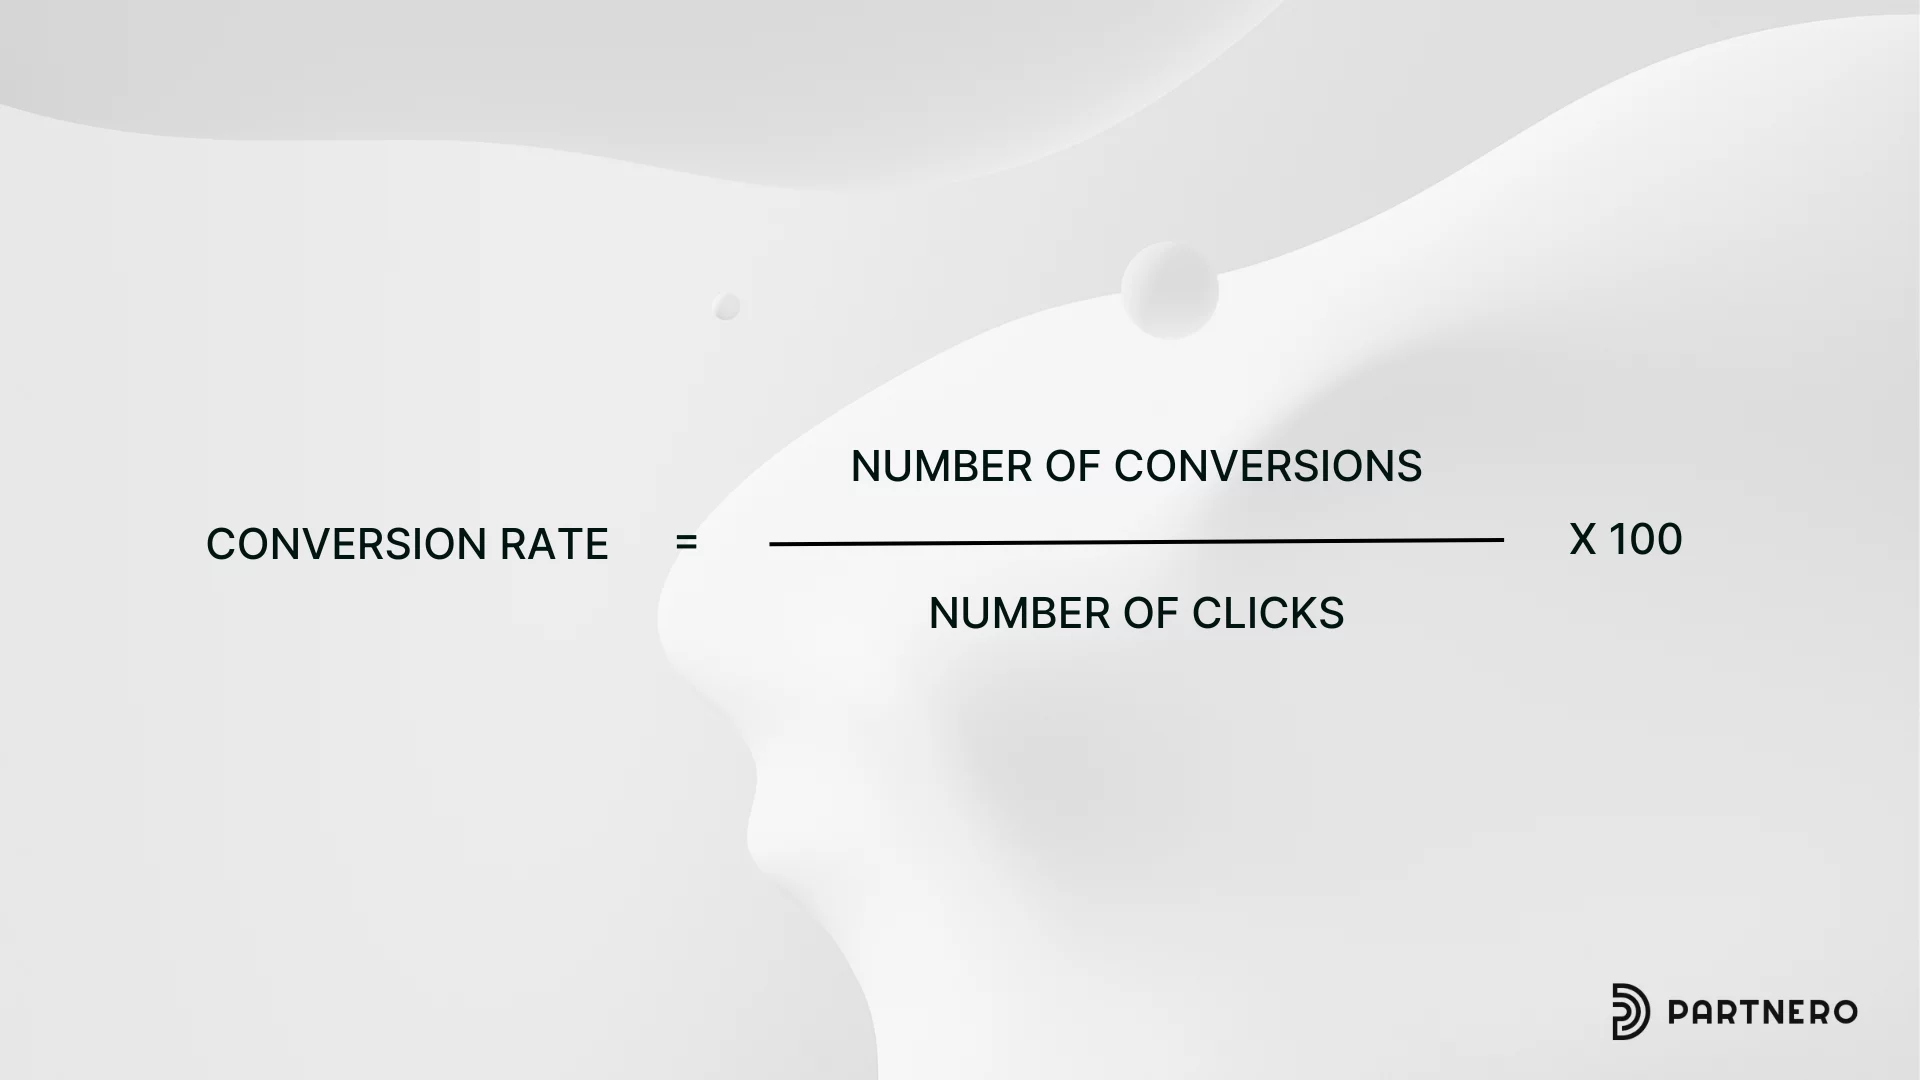
Conversion Rate measures the percentage of visitors who complete a desired action, such as making a purchase or signing up for a newsletter, after clicking on your affiliate link. You decide the desired action!
Conversion benchmark for affiliate marketing
Average conversion rates typically range from 1% to 3% across different industries, but top performers can achieve 5% or higher rates. The higher your number of conversions, the better! The number of clicks doesn’t matter here, but the desired action taken does.
Why it matters: This metric directly impacts your earning potential. A high conversion rate means you're not just driving traffic but quality traffic likely to convert into sales or leads. This helps to increase revenue and profits, boosting your bottom line. This metric can be a benchmark or KPI.
3. Average Order Value (AOV)
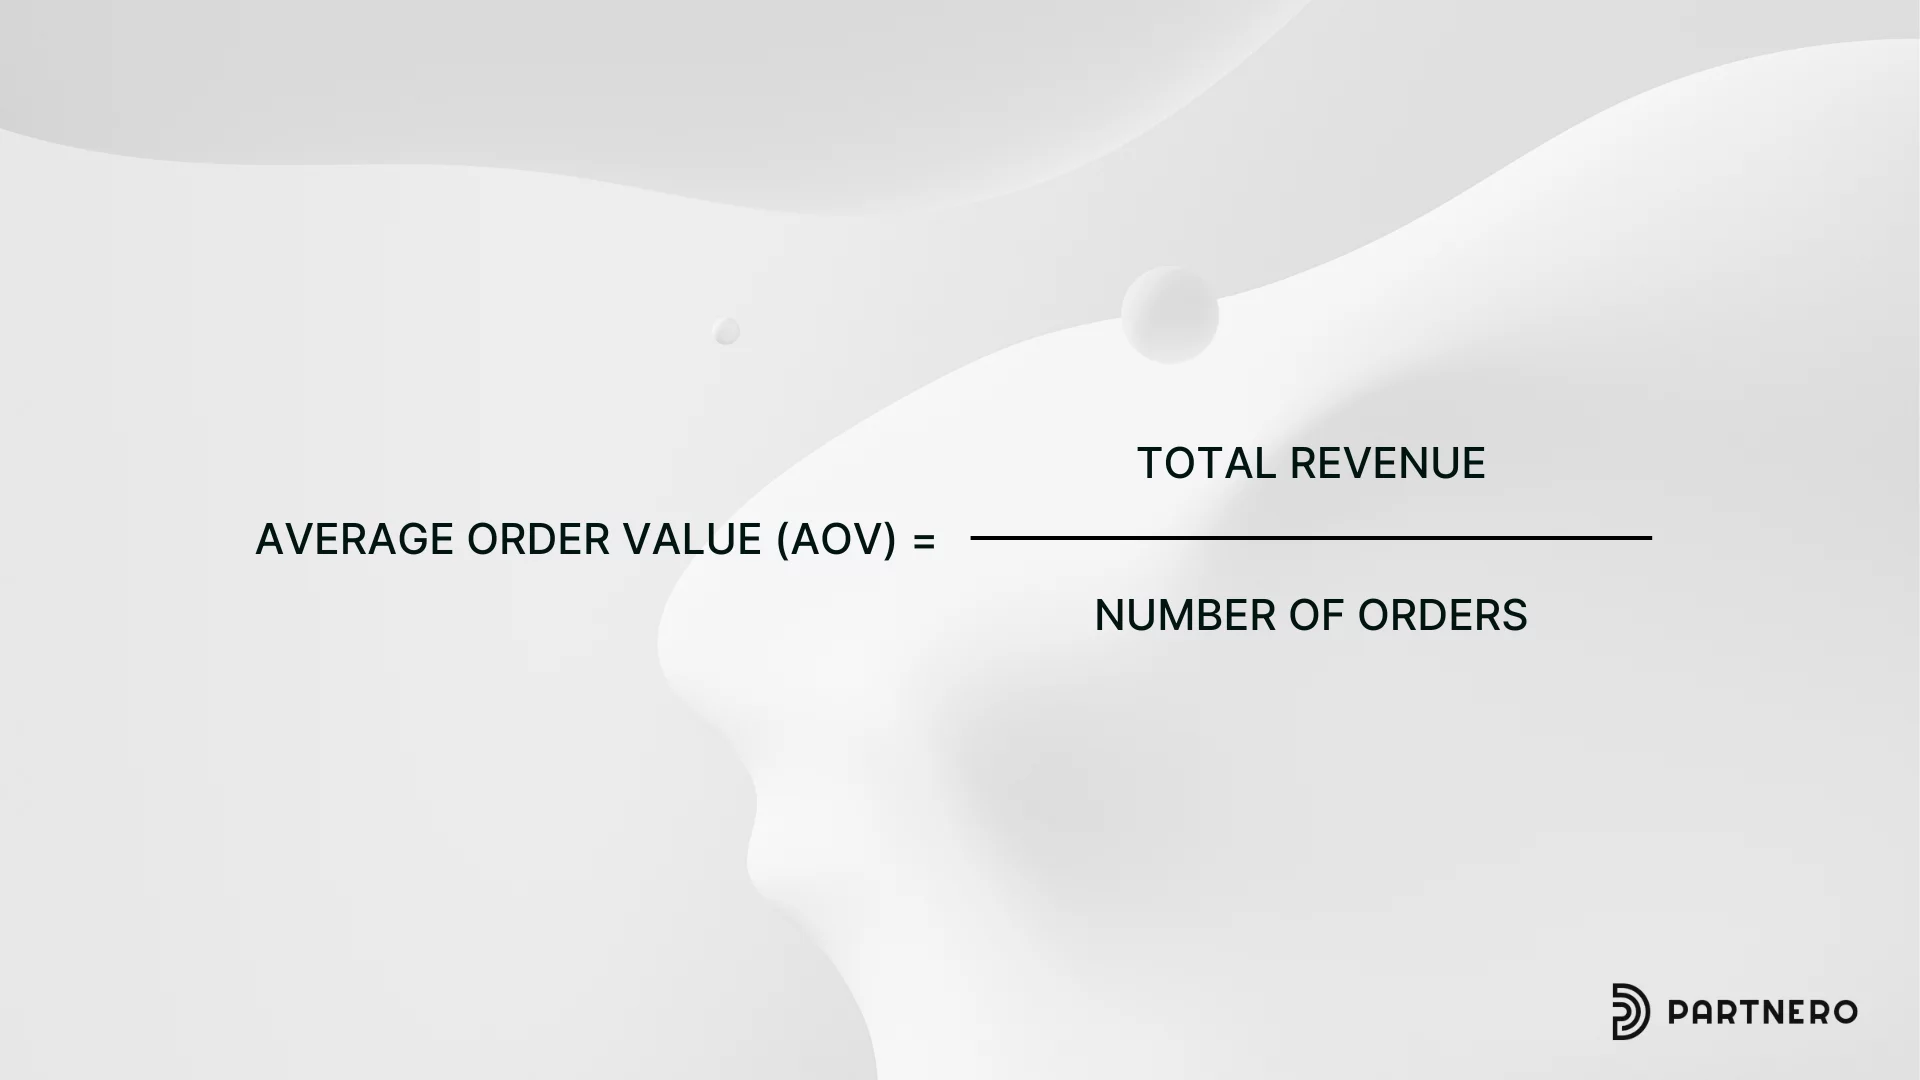
Average Order Value (AOV) measures the average amount customers spend per transaction through your affiliate links.
AOV benchmark for affiliate marketing
AOV varies widely depending on the industry and products being sold. In e-commerce, for example, it can range from $50 to $200 or more. Affiliates in the retail and e-commerce sector often see an AOV increase of 10% to 15% compared to other marketing channels due to the targeted nature of affiliate marketing.
Why it matters: Increasing your AOV can significantly boost your overall revenue without necessarily increasing traffic or conversion rates. Instead of the quantity sold, this metric focuses on how much you can sell in a single transaction. This metric can be a benchmark or KPI.
4. Earnings Per Click (EPC)
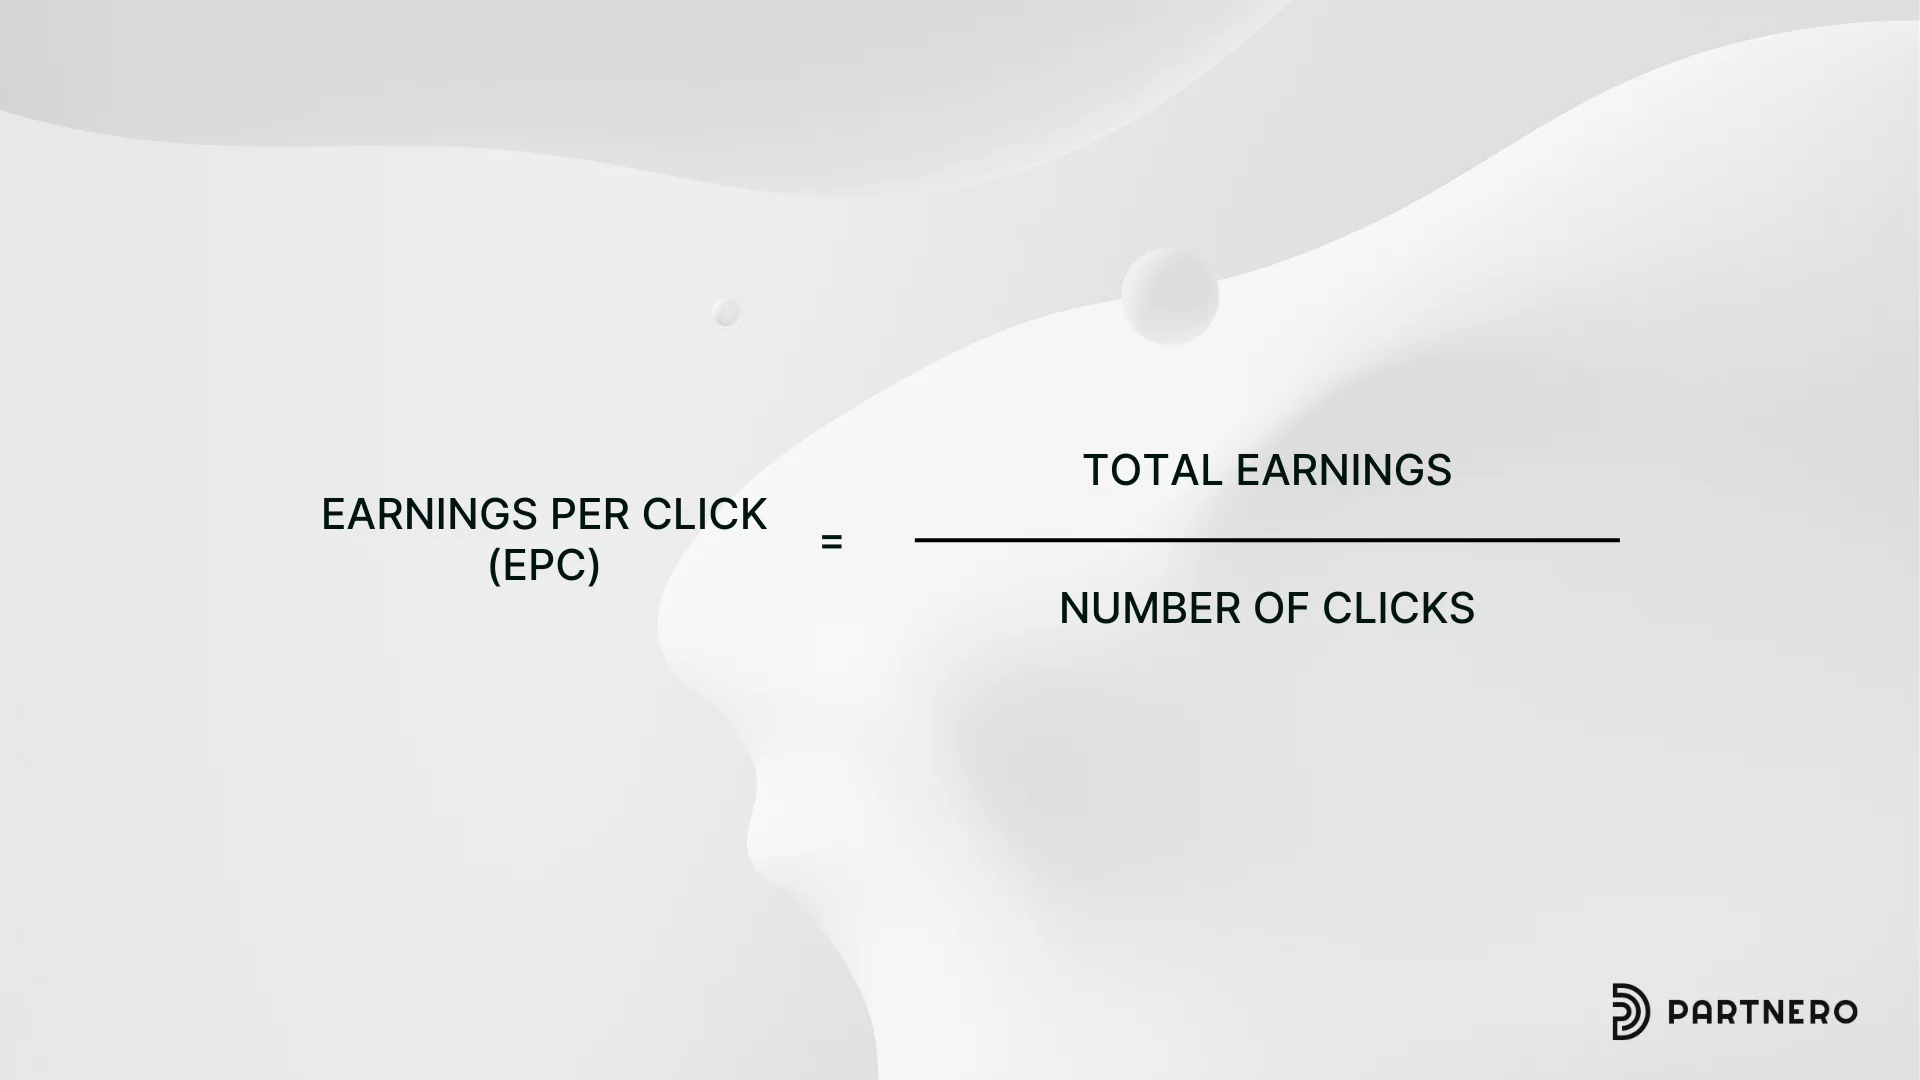
Earnings Per Click (EPC) shows how much you earn on average for each click on your affiliate links.
EPC benchmark for affiliate marketing
A good EPC is any EPC that is higher than your Cost Per Click (CPC). This depends on the niche and product type. Higher EPC values indicate more effective campaigns and better-earning potential for affiliates. To gauge its effectiveness, it's important to compare your EPC against industry standards and your historical performance.
Why it matters: EPC helps you compare the performance of different affiliate programs and products, allowing you to focus on the most profitable opportunities. This metric can be a benchmark or KPI.
5. Revenue Per Visitor (RPV)
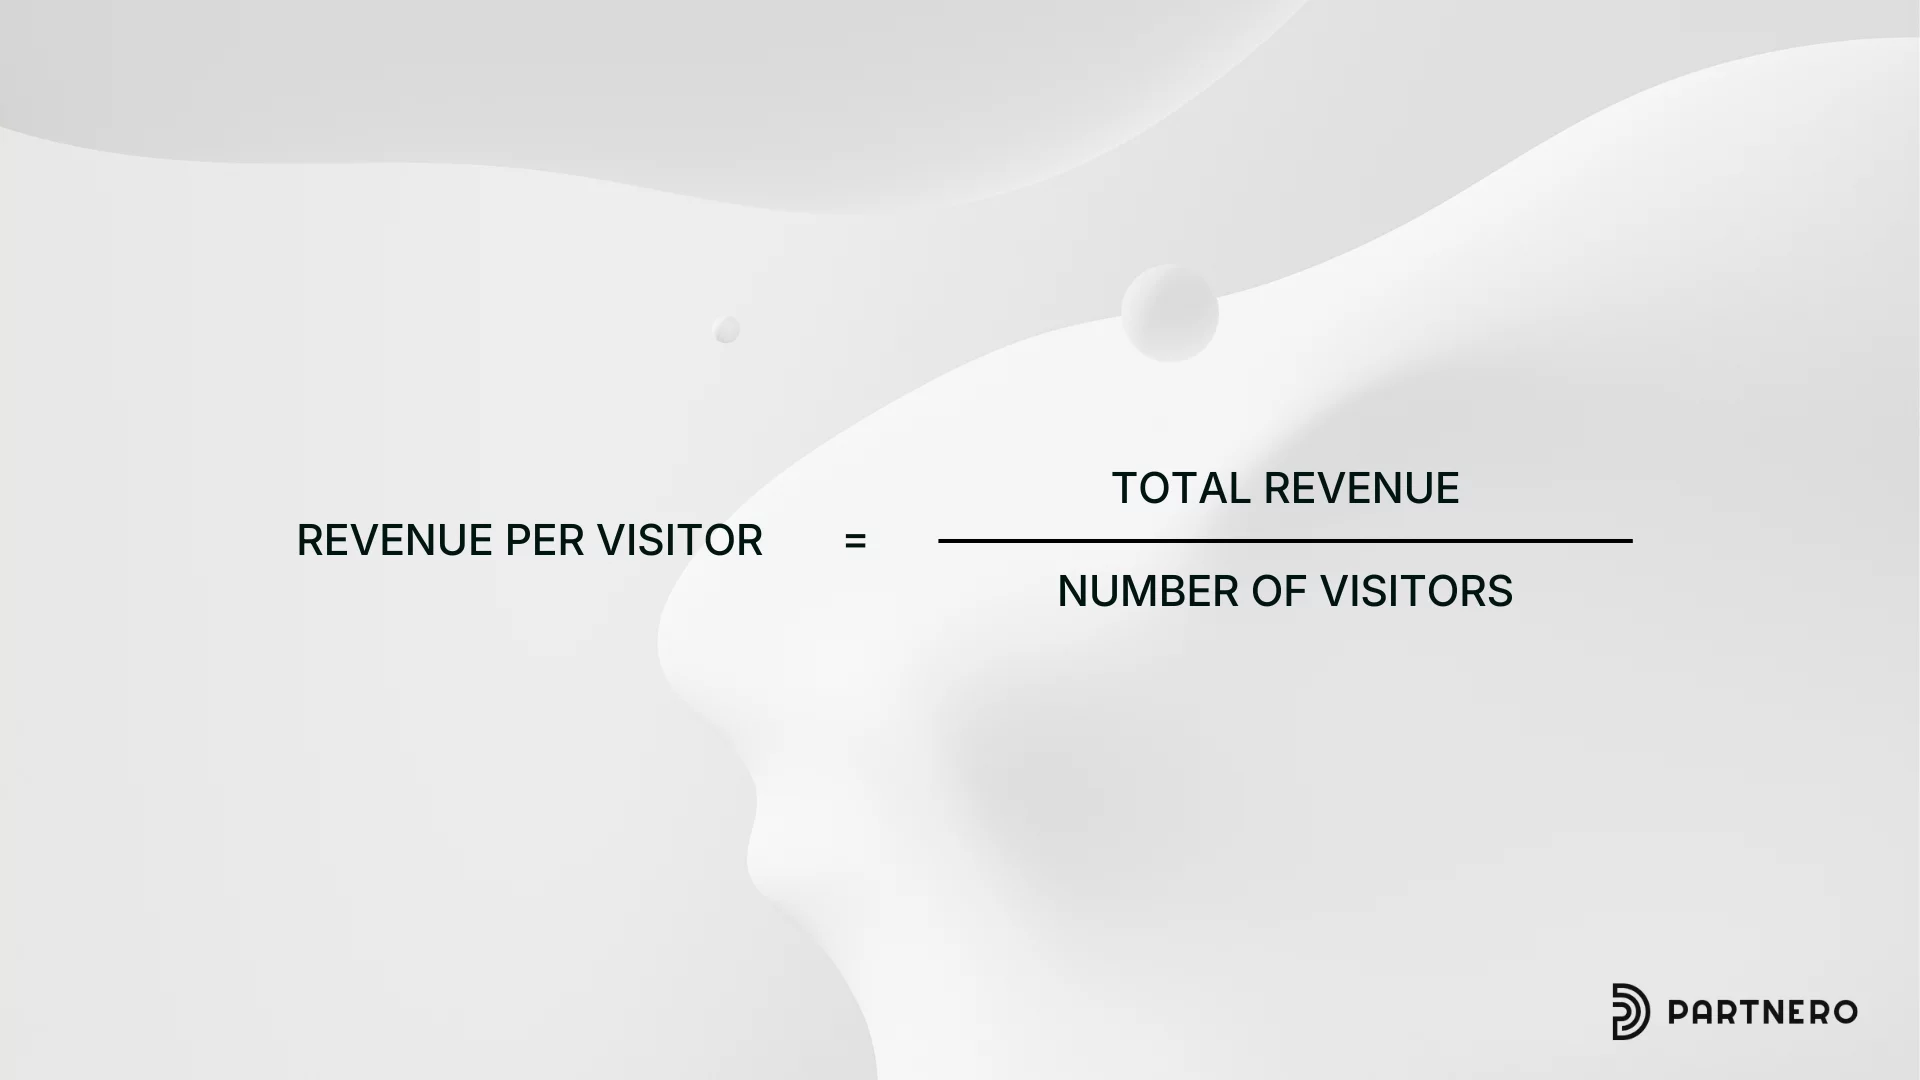
Revenue Per Visitor (RPV) measures how much revenue you average from each visitor to your affiliate content. Tracking RPV over time can help you identify trends and areas of improvement within your affiliate program and with your sales team.
Read more: 9 Ways Partnership and Sales Teams Can Work Together to Boost Revenue
RPV benchmark for affiliate marketing
RPV can vary significantly across different industries. For example, RPVs for Home & Furniture or Beauty & Personal Care brands tend to be higher. A good RPV, similar to EPC, is higher than your CPC. It all comes down to costs.
Why it matters: This metric helps you understand the overall value of your traffic and can guide decisions on traffic acquisition strategies. This metric can be a benchmark or KPI.
6. Cost Per Acquisition (CPA)
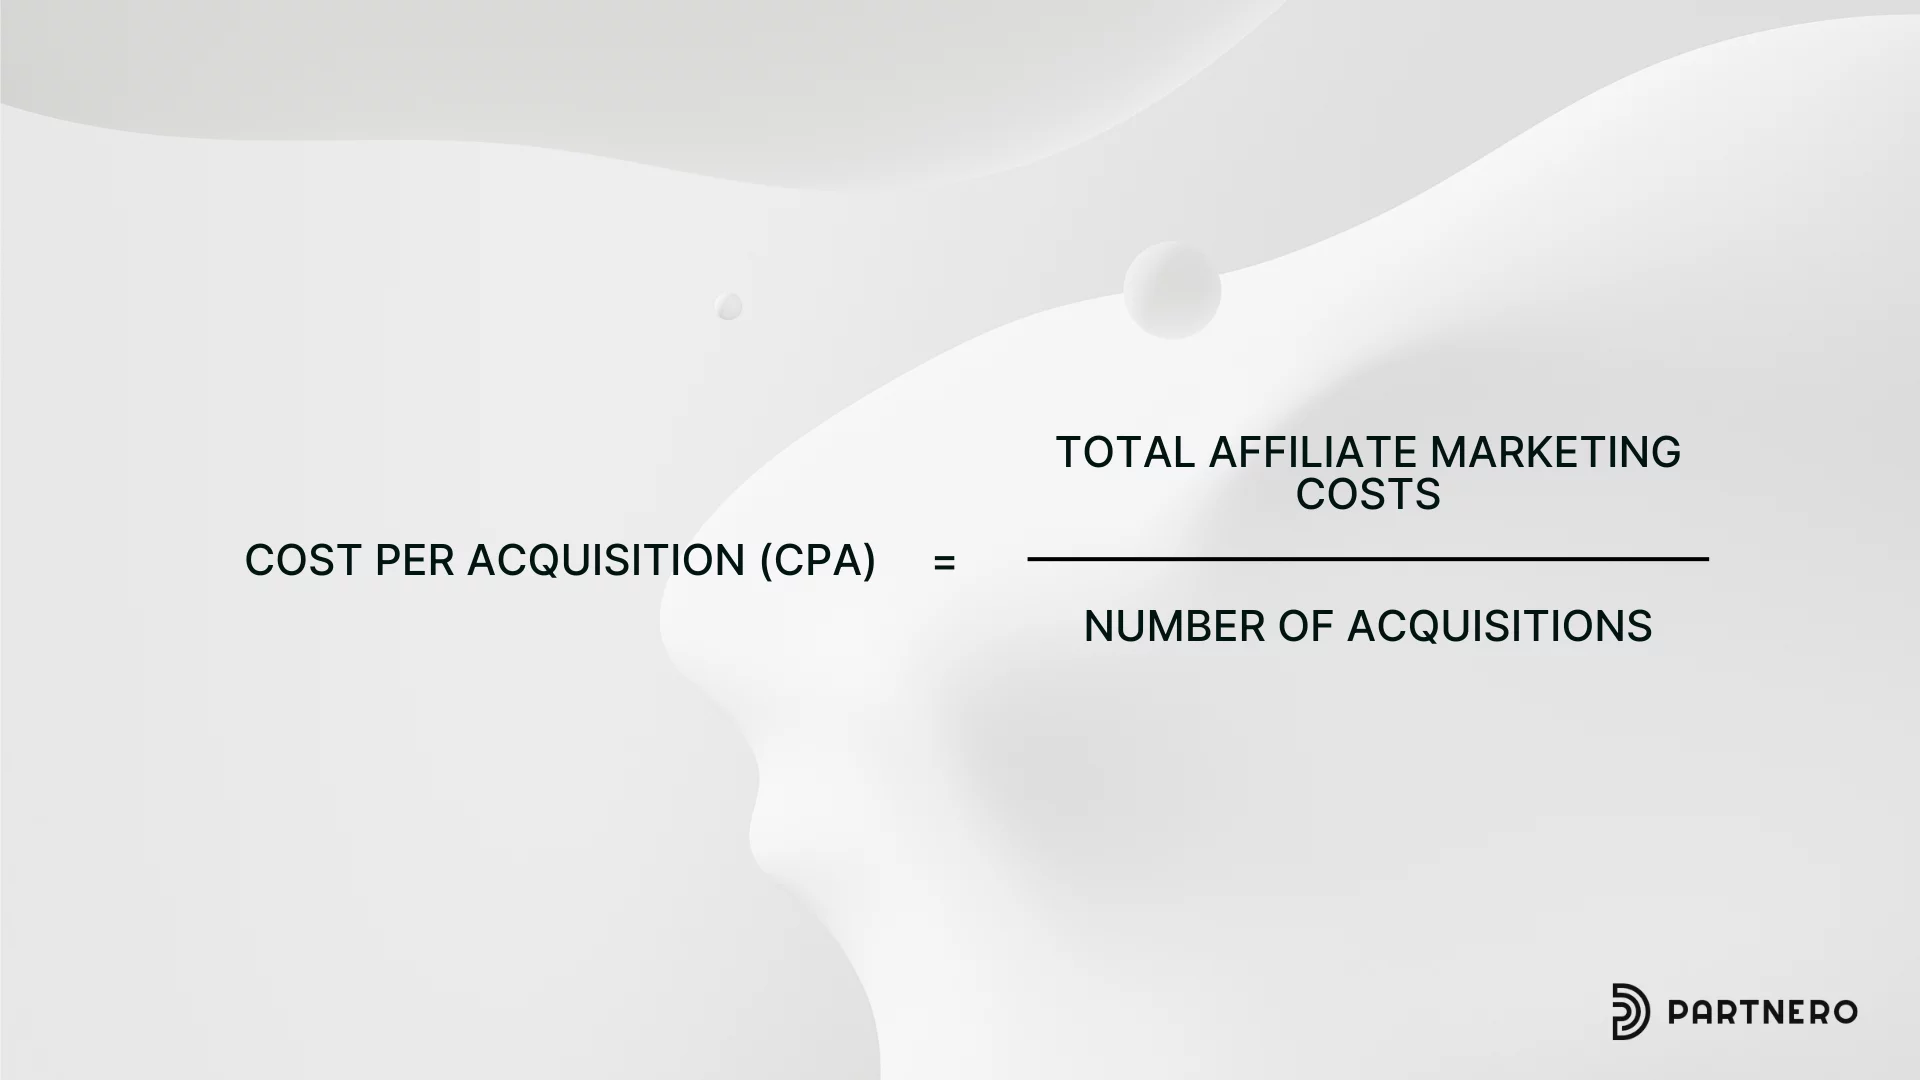
Cost Per Acquisition (CPA) represents the average cost to acquire a new customer through your affiliate marketing efforts. Cost Per Lead (CPL) is a similar metric but measures the cost of each lead, instead of new customer acquired. Each lead can become a new customer.
CPA benchmark for affiliate marketing
A good CPA depends on your profit margins and varies from industry to industry. Generally, it should be significantly lower than your Average Order Value (AOV) or Customer Lifetime Value (CLV).
Why it matters: CPA helps you determine the profitability of your affiliate marketing campaigns and ensure you're not spending more to acquire customers than they're worth. This metric can be a benchmark or KPI.
7. Cost Per Lead (CPL)
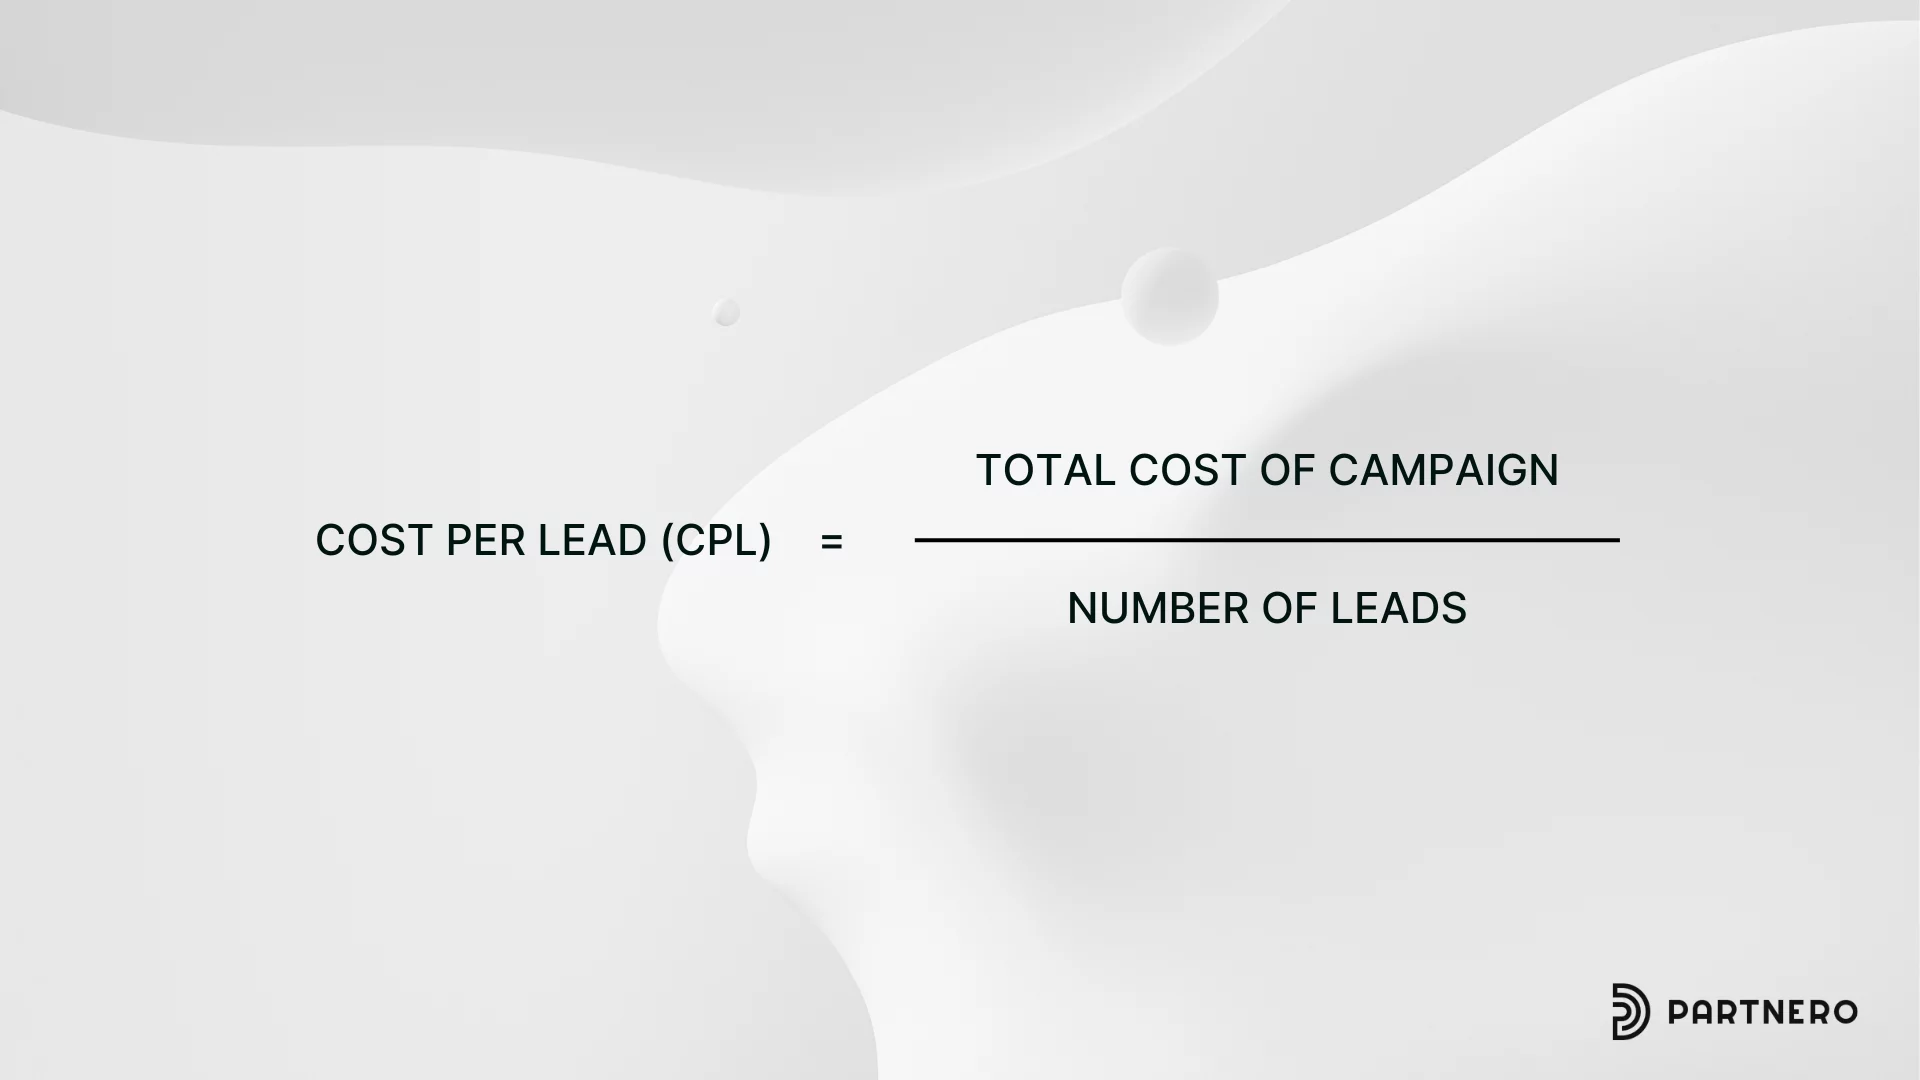
Cost per Lead (CPL) is an important metric in affiliate marketing and digital advertising, measuring lead generation campaigns' cost-effectiveness. Cost per Lead refers to the money a business spends to acquire a single lead.
A lead is typically defined as a potential customer who has shown interest in a product or service by providing their contact information or taking a specific action. Cost per Lead can measure a conversion, especially if the desired action is the same. However, a conversion can’t necessarily be measured by CPL.
CPL benchmark in affiliate marketing
As a general rule of thumb, the lower your CPL, the better. Like the CPA, this depends on your profit margins and varies from industry to industry.
Why it matters: In affiliate marketing, CPL helps determine appropriate commission rates for affiliates based on performance and control costs while scaling lead generation efforts. This metric can be a benchmark or KPI, but is more likely to be a KPI.
8. Return on Ad Spend (ROAS)
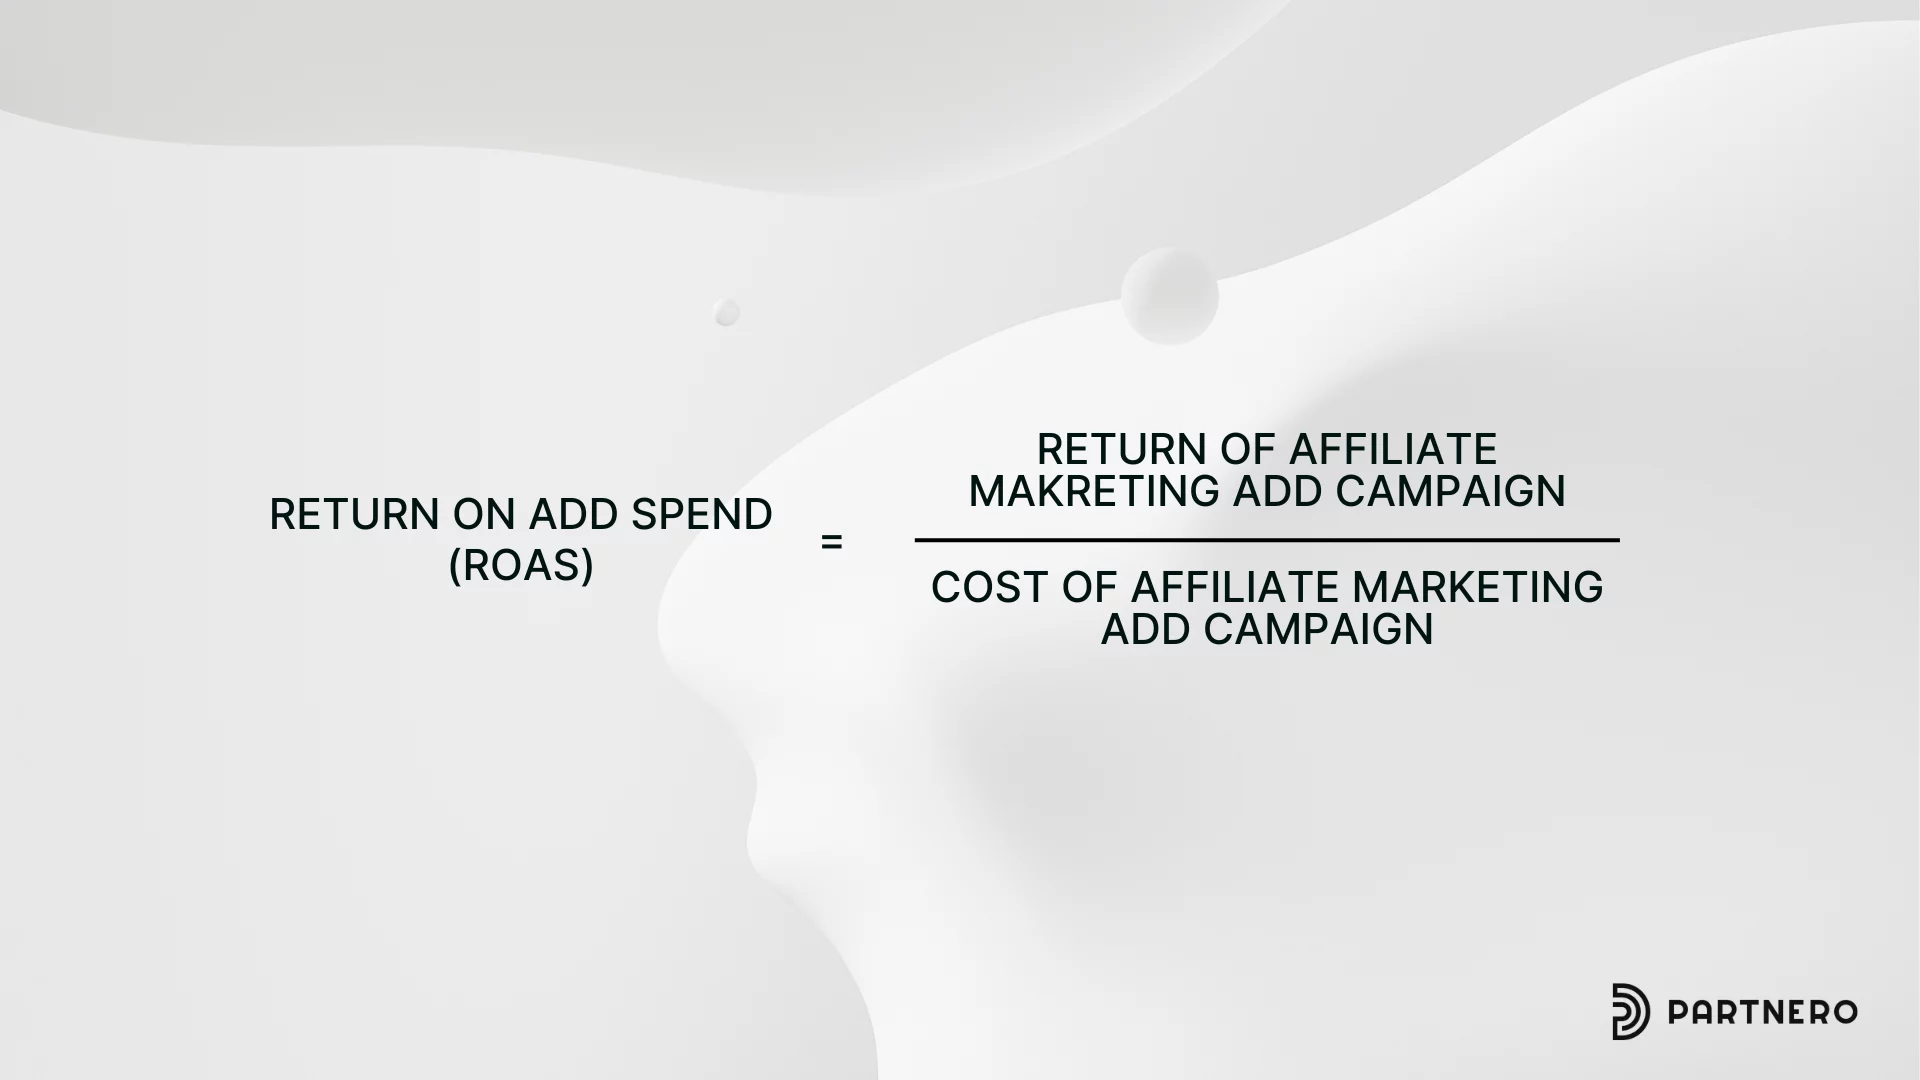
Return on Ad Spend (ROAS) measures the revenue generated for every dollar spent on advertising your affiliate content if you or your affiliates are running ads! This is used to measure general digital marketing success, too.
ROAS benchmark for affiliate marketing
A ROAS of 4:1 (or 400%) is often considered good, meaning you earn $4 for every $1 spent on advertising. This may reflect the quality of your affiliate ad campaign.
Why it matters: ROAS helps you evaluate the effectiveness of your paid advertising efforts in promoting affiliate products or services. This metric can be a benchmark or KPI.
9. Affiliate Link Click-to-Sale Time
Affiliate Link Click-to-Sale Time measures the average time between when a user clicks on your affiliate link and completes a purchase.
Affiliate Link Click-to-Sale Time benchmark for affiliate marketing
The ideal click-to-sale time varies by industry and product type, but generally, shorter is better. It might be minutes for impulse purchases, while for considered purchases, it could be days or weeks.
Why it matters: Understanding this timeframe can help optimize your follow-up strategies and set appropriate cookie durations for your affiliate links. This metric can be a benchmark or KPI, but is more likely to be a KPI.
10. Mobile vs. Desktop Performance

Compare your organic traffic on different devices–mobile and desktops are the most common. This comparison looks at how your affiliate marketing efforts perform across different devices.
Mobile vs. desktop benchmark for affiliate marketing
Mobile traffic often accounts for 58.21% of total internet traffic worldwide. Mobile devices have a year-over-year growth rate of 15%, but conversion rates on the desktop can be 1.5 to 2 times higher than on mobile. This is especially true among e-commerce and lead generation brands. Doom scrolling and lack of ability to zoom are contributing factors.
Why it matters: Knowing how your audience interacts with your content across devices can help you optimize your affiliate marketing strategy for each platform. This metric can be a benchmark or KPI, but is more likely to be a KPI.
11. New vs. returning visitor Conversion Rate

This compares the conversion rates of first-time visitors versus returning visitors brought to your website by affiliate marketing. This metric gives you insight into how visitors interact with your website and can help build a customer or buyer journey map. This can easily be found on Google Analytics.
New vs. returning visitor CR benchmark for affiliate marketing
When it comes to new vs. returning conversion rates, some businesses may strive for a 50:50 balance or a 20:80 focus on converting returning customers, but this depends on your business strategies and goals.
These results will show you whether you’re doing a great job converting new and returning visitors. Returning visitors often tend to have a lower bounce rate and a higher conversion rate. Returning visitors are 73% more likely to convert than new visitors.
Why it matters: This insight can help you tailor your content and strategies to engage new and returning visitors effectively. However, visitors could use multiple devices to access your website and be considered different users. Keep this in mind for accuracy.
12. Affiliate Program Activation Rate
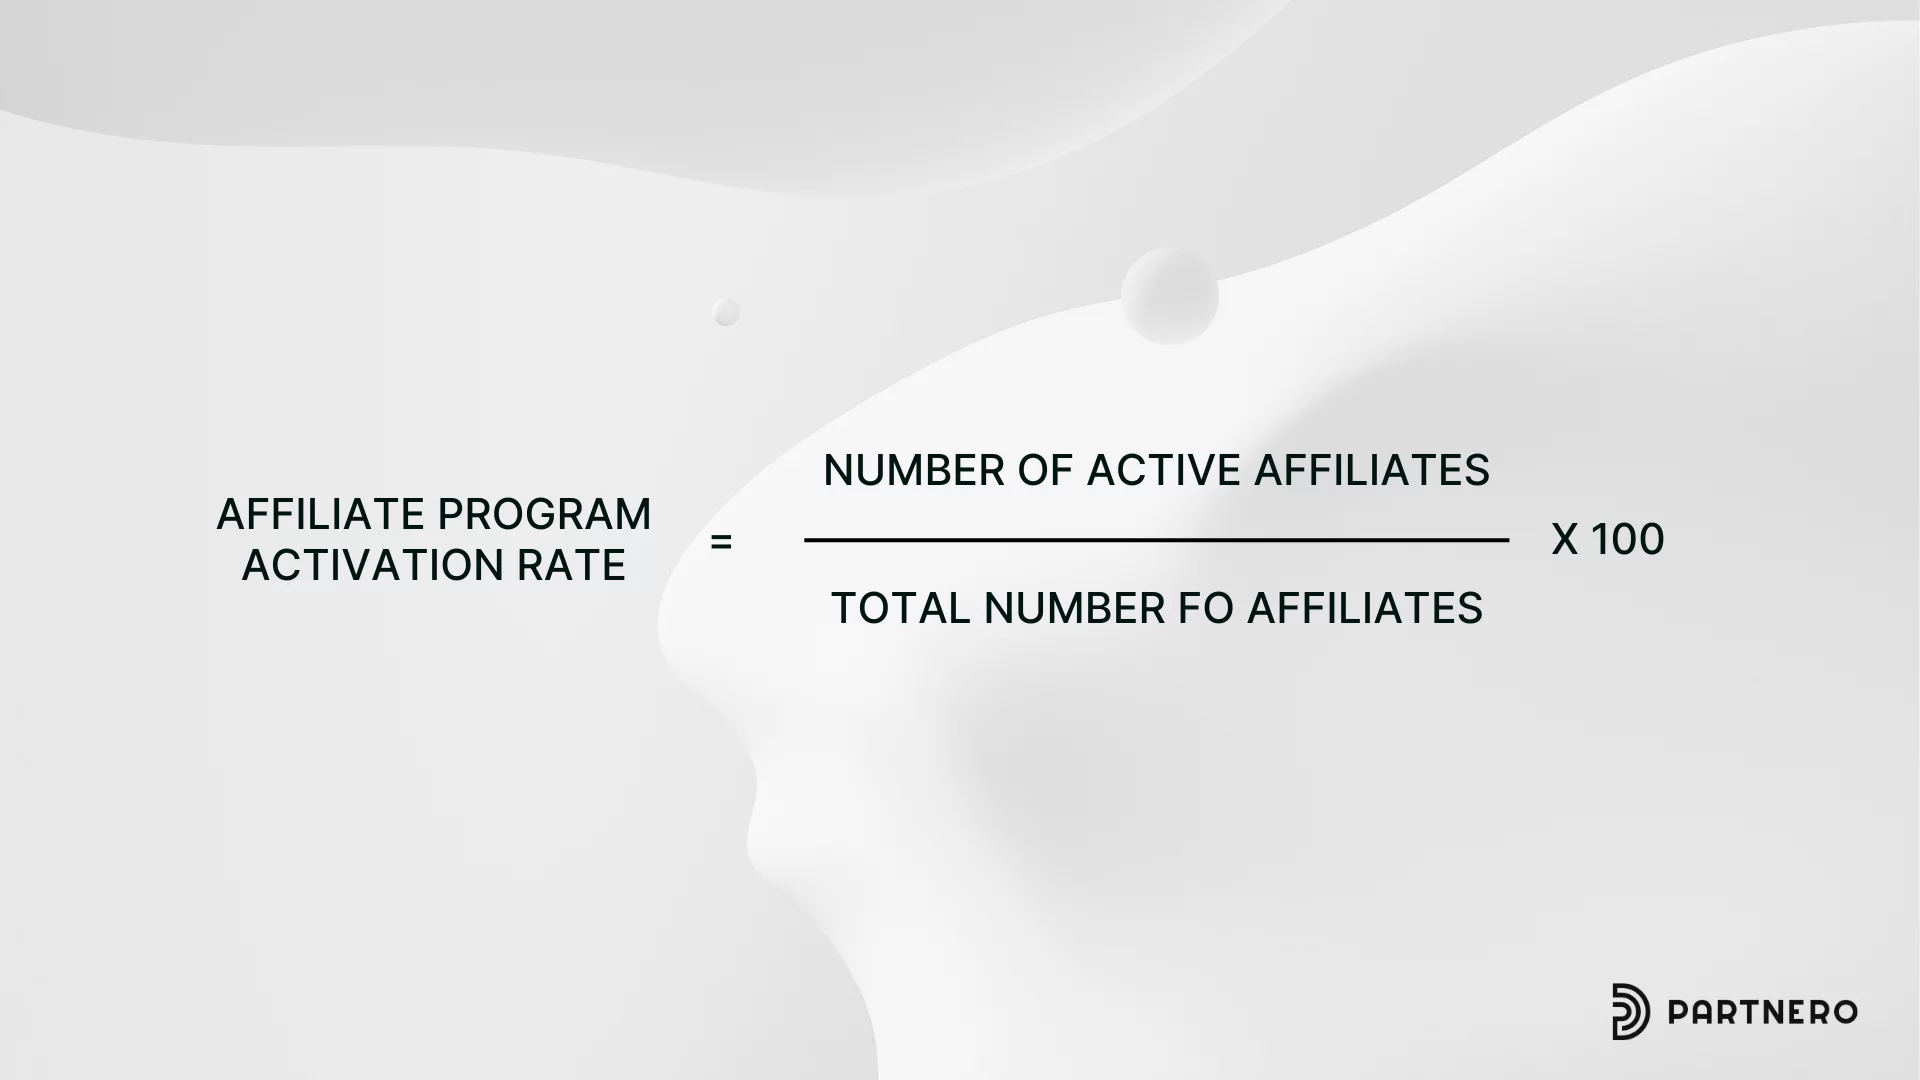
The affiliate program activation rate measures the percentage of affiliates actively promoting your products or services after signing up for your program.
Affiliate program activation rate benchmark
A good activation rate is typically around 10% or more, but top programs can achieve 50% or higher rates. Rakuten, for example, is one of the largest and most active affiliate marketing networks.
Why it matters: A high activation rate indicates that your products or services are attractive and easy for affiliates to promote. It also shows how easy to navigate or how attractive your affiliate program structure or commission rate is. This metric can be a benchmark or KPI, but is more likely to be a KPI.
13. Average Commission Rate
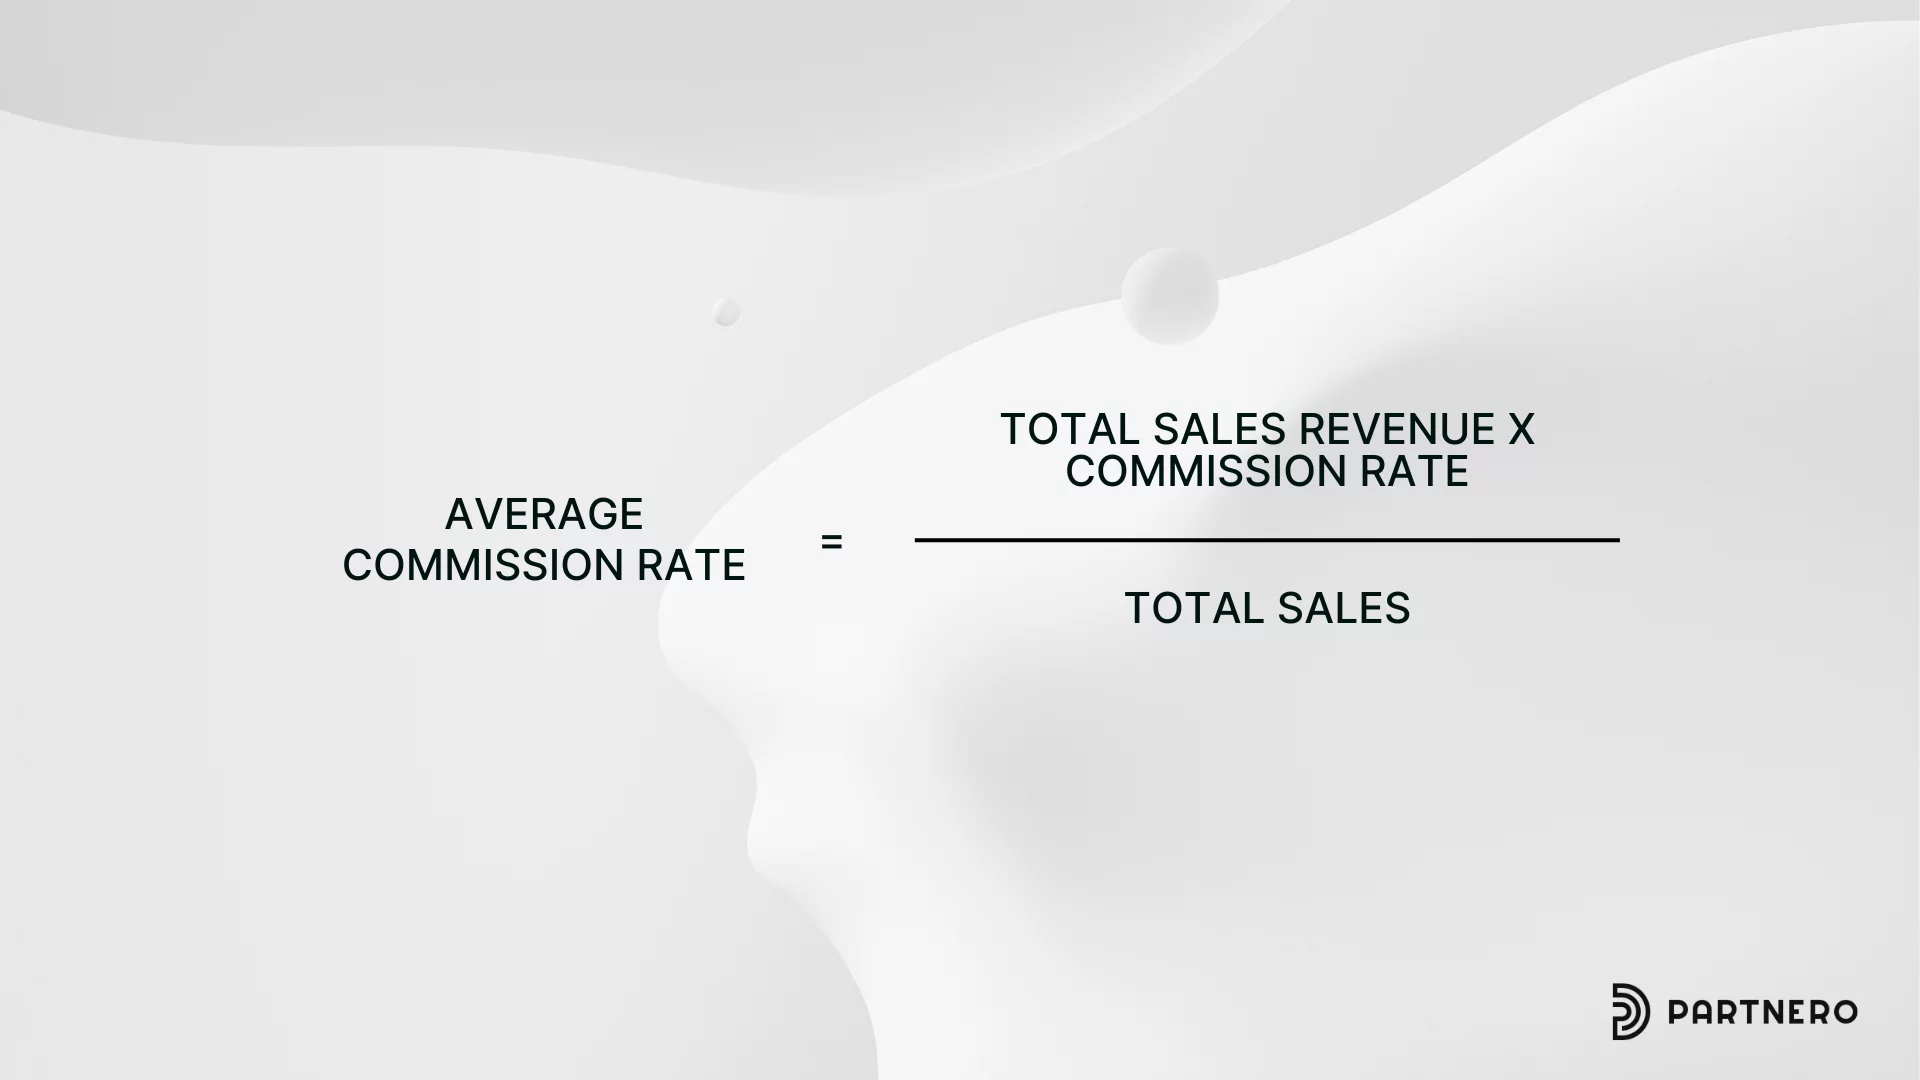
The average commission rate is the average percentage or fixed amount of sales or leads (pay per lead) you pay your affiliates for bringing in new business, influencing sales, or completing a desired action. Affiliates can influence up to 20% of e-commerce sales. Commission rates can also be tiered.
Average commission rate benchmark
The average commission rate generally ranges between 5% to 30% of the sale value. Commission rates can vary widely by industry for affiliate marketers, ranging from 5% for retail and e-commerce to 20% or more for digital products.
Why it matters: Finding the right balance in your commission structure is crucial for attracting quality affiliates while maintaining profitability. Factors that may affect commission structure include the difficulty of sale, length and complexity of the sales cycle, industry standards, and more. This metric can be a benchmark or KPI.
14. Affiliate Retention Rate
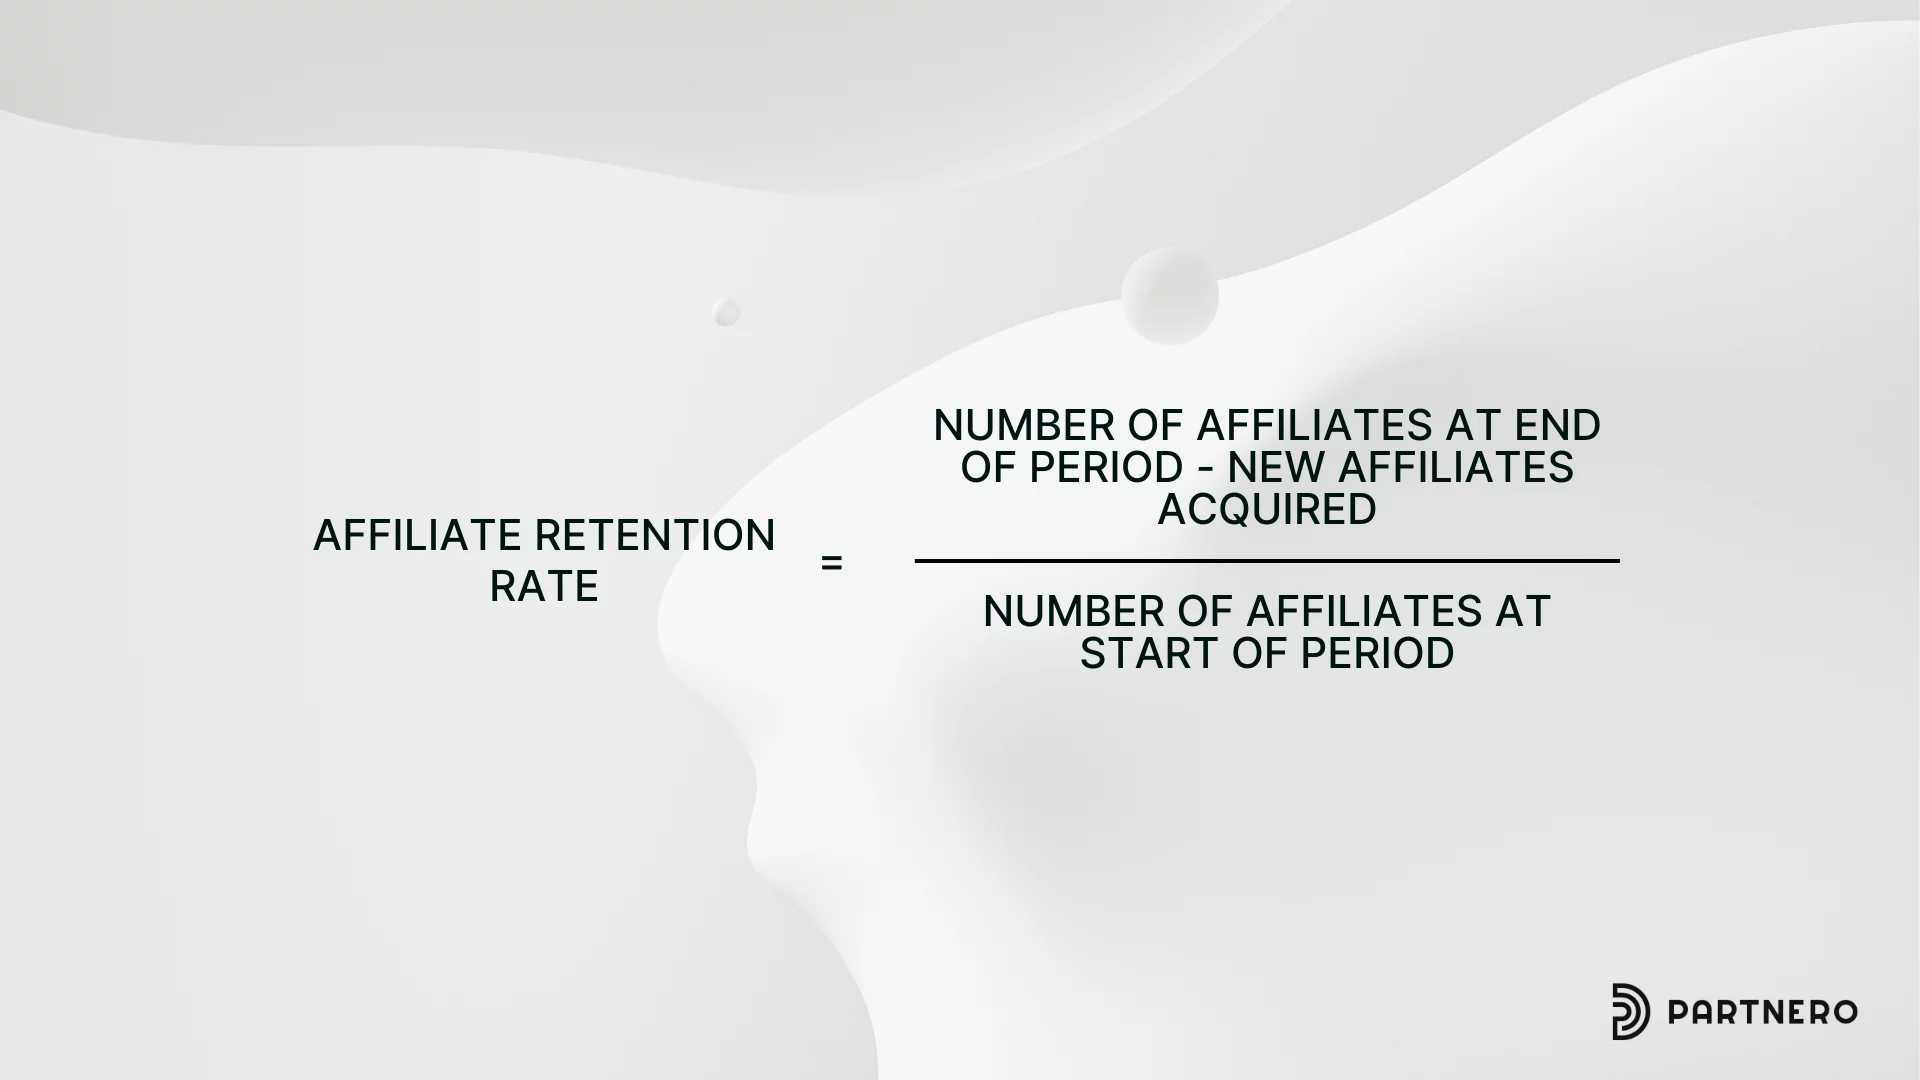
This metric measures the percentage of affiliates who continue actively promoting your products and engaging with your brand over time.
Affiliate retention rate benchmark
A good retention rate is typically around 30%, but top programs can achieve 80% or higher rates. A high customer retention rate can boost affiliate retention rate, too. Higher customer retention rate means you’ll have more people who can potentially be in your affiliate network.
Why it matters: High retention rates indicate that your affiliate program is providing long-term value to your partners–this could be great training, high commissions, and other perks. This metric can be a benchmark or KPI, but is more likely to be a KPI.
Read more: 9 Strategies That Boost Collaboration, Loyalty, & Sales
15. Traffic Source Distribution

This breaks down where your affiliate traffic is coming from (e.g., social media, blogs, email marketing).
Traffic cource distribution benchmark
The ideal traffic source mix varies by industry, but a diverse range of sources is generally beneficial. Organic search and SEO efforts contribute to about 50% of affiliate traffic, followed by paid search at 15% and social media at 10%, highlighting the importance of diverse traffic sources.
Why it matters: Understanding your top-performing traffic sources can help you and your content creators focus your efforts and resources on the most effective channels. This metric can be a benchmark or KPI, but is more likely to be a KPI.
16. Affiliate content and link placement performance

This involves tracking which types of affiliate content (e.g., product reviews, comparison articles, video tutorials) and link placements within affiliate content (e.g., in-text links, banner ads, product widgets) perform best in terms of clicks and conversions.
Many affiliate partners are content creators, and this is how they influence and persuade their audience to buy your products and services
Affiliate content performance and link placement benchmark
Performance varies by niche, but in-depth product reviews and comparison articles generally perform well. Link placements also matter–in-content text links often outperform banner ads.
Why it matters: Knowing which content types resonate with your audience can guide your content creation strategy. Furthermore, optimizing link placement within your affiliate content can significantly improve your CTR and overall affiliate performance. This metric can be a benchmark or KPI, but is more likely to be a KPI.
17. Customer Lifetime Value (CLV)
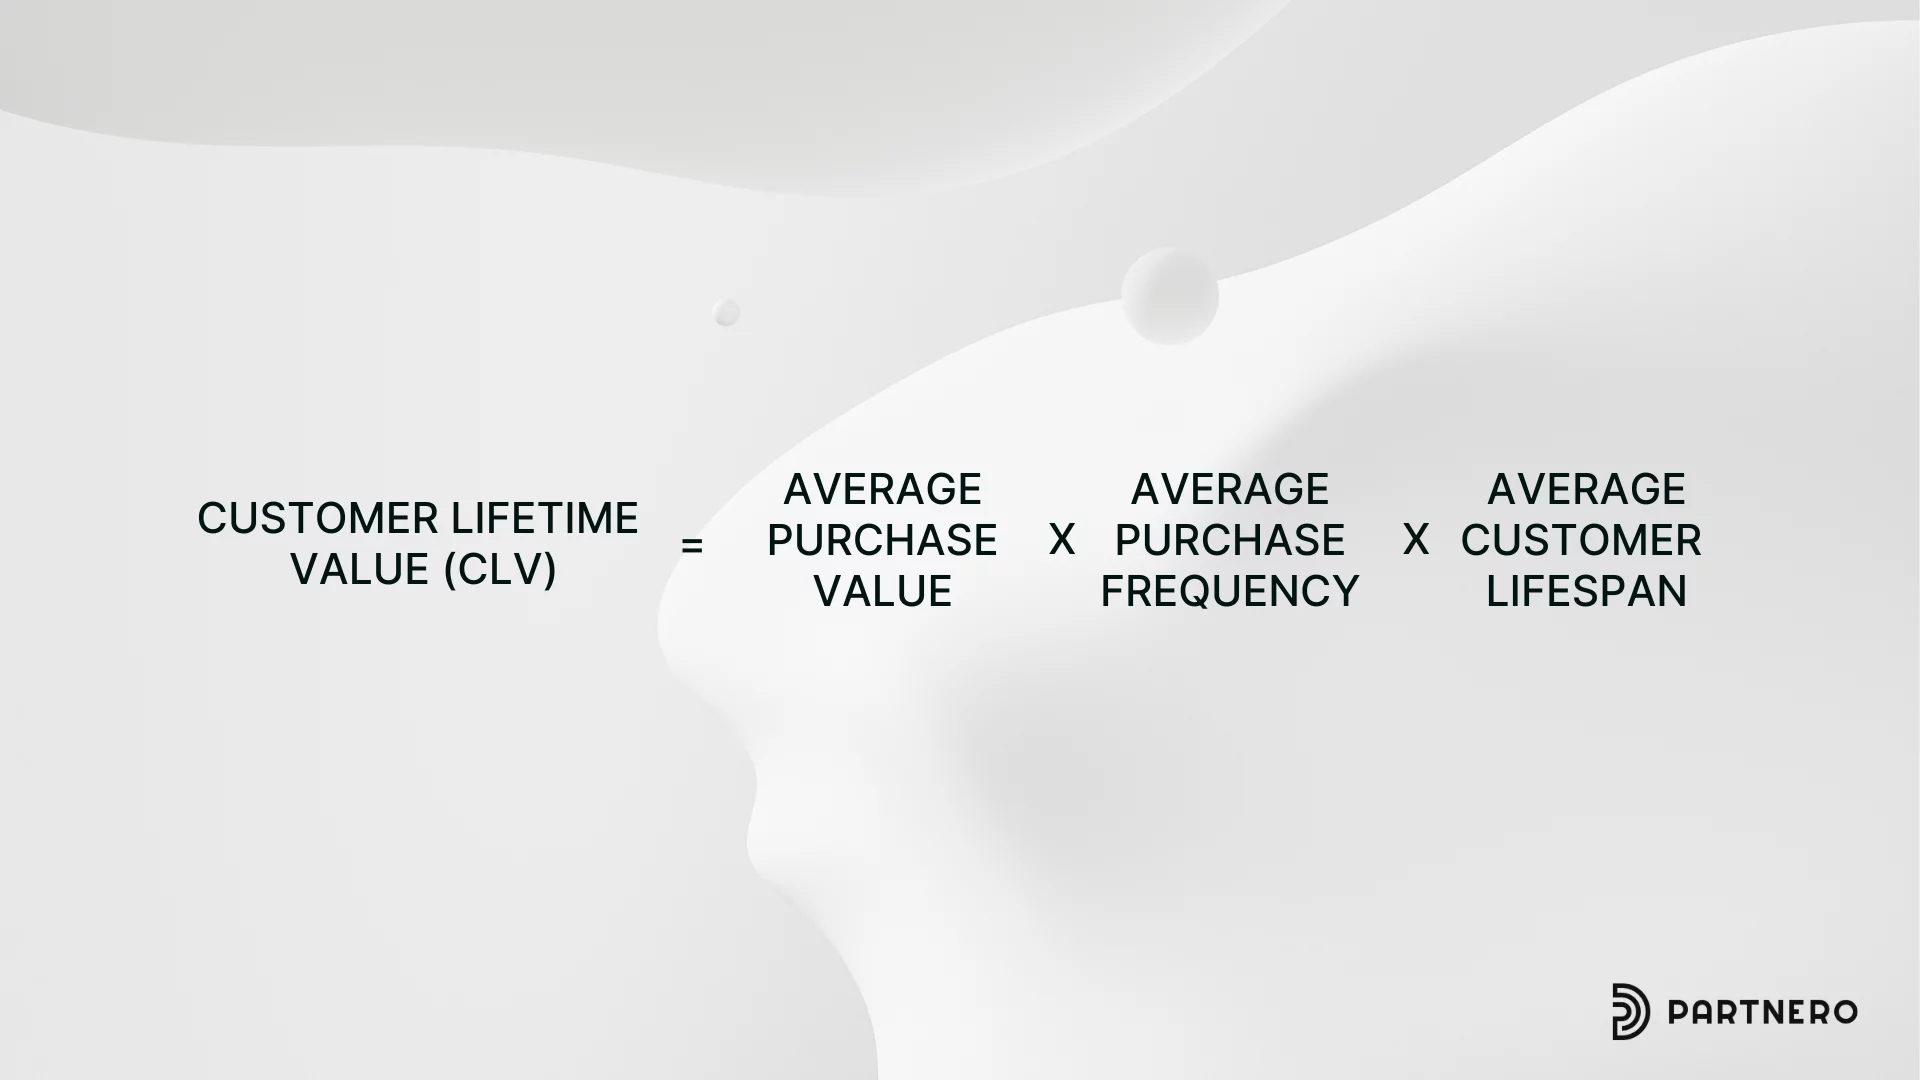
Customer Lifetime Value (CLV) estimates the total revenue a business can expect from a single customer account throughout their relationship. This tracks all customer interactions and transactions with your company through your affiliate network and beyond.
This can also help you segment customers by grouping them based on their lifetime value.
Customer Lifetime Value benchmark
A good CLV depends on your industry and business model, but it should be significantly higher than your Customer Acquisition Cost or Cost per Lead at least three times.
Why it matters: Understanding CLV helps determine how much you can afford to spend on acquiring customers through affiliate marketing. This metric can be a benchmark or KPI, but is more likely to be a KPI.
18. Affiliate Engagement Rate
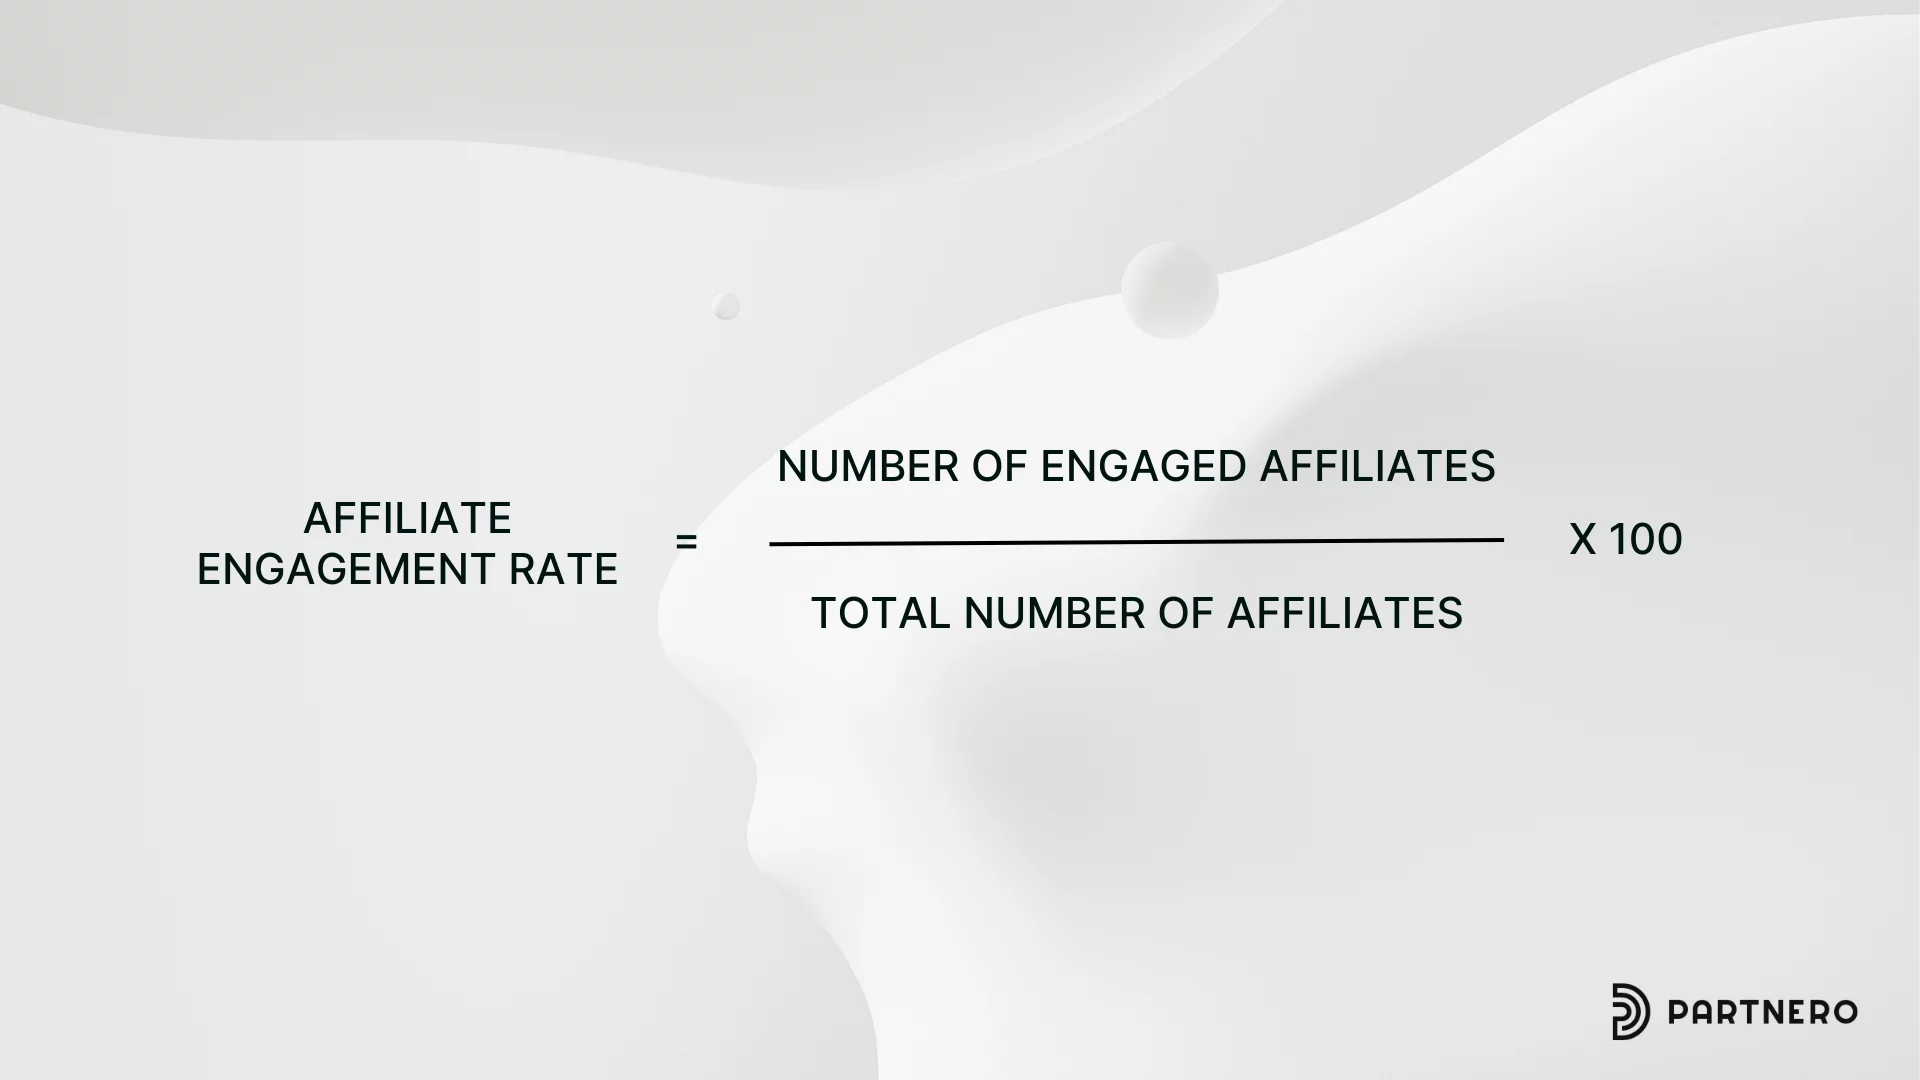
Affiliate Engagement Rate measures how actively your affiliates interact with your program, including logging into their dashboard, accessing marketing materials, and participating in promotions.
Read more: Partner Onboarding 101
Affiliate Engagement Rate benchmark
The higher your engagement rate. The typical engagement rate is 15-30%. However, a good engagement rate is typically around 40-50%, but top programs can achieve rates of 60% or higher
Why it matters: High engagement rates often correlate with better program performance and affiliate satisfaction. This metric can be a benchmark or KPI, but is more likely to be a KPI.
19. Affiliate Fraud Rate
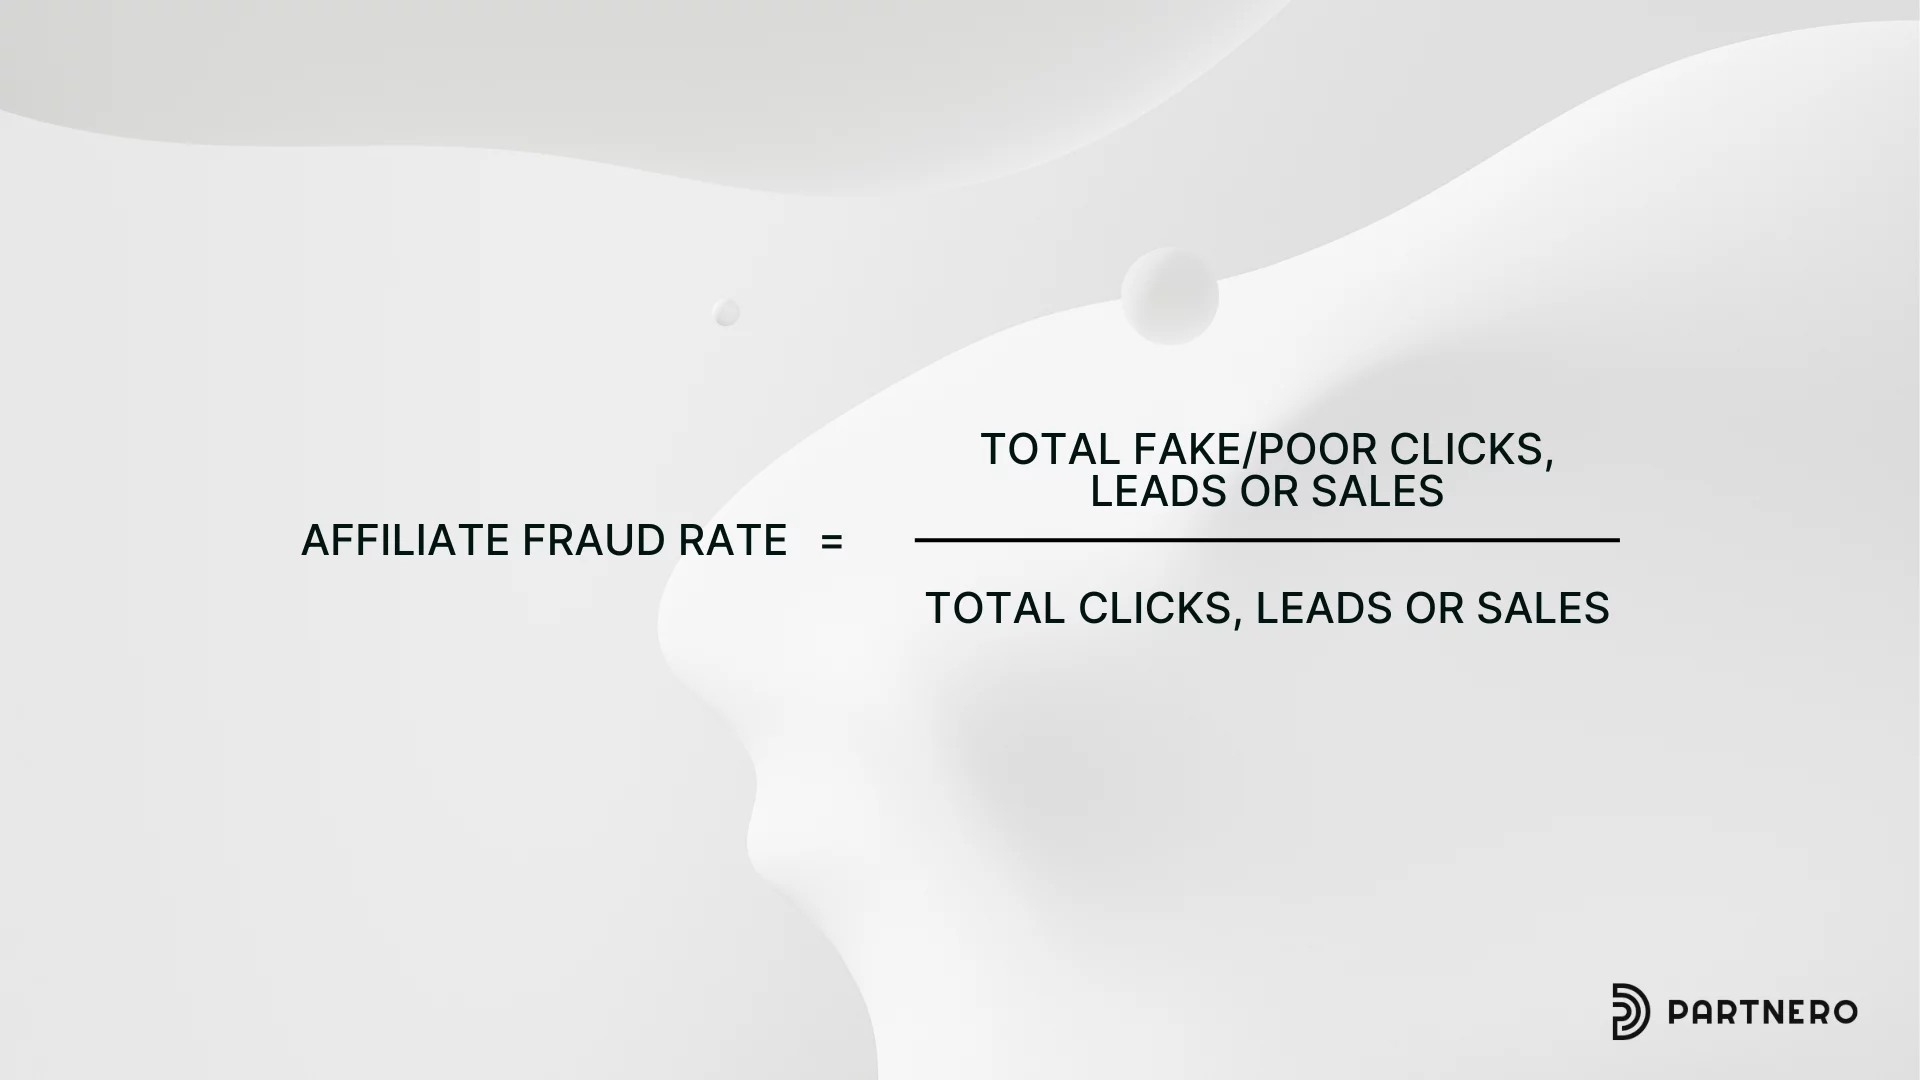
Affiliate Fraud Rate measures the percentage of fraudulent or invalid activities in your affiliate program.
Affiliate Fraud Rate benchmark
While fraud is concerning, keeping this rate below 1% is generally considered good. It’s hard to tell genuine clicks from false clicks. Today, ~24% of all clicks are from bots, and ~17% of all clicks from affiliate traffic are fraudulent.
According to Marketo, ~25% of leads generated by affiliate marketing campaigns are fake or low quality. Cooking stuffing also falsely attributes sales to affiliate marketing. Lastly, mobile affiliate fraud is 50% higher than desktop due to poor mobile tracking.
Why it matters: Monitoring for fraud is crucial to maintaining the integrity of your affiliate program and ensuring fair compensation for legitimate affiliates. This metric can be a benchmark or KPI, but is more likely to be a KPI.
20. Affiliate Program Growth
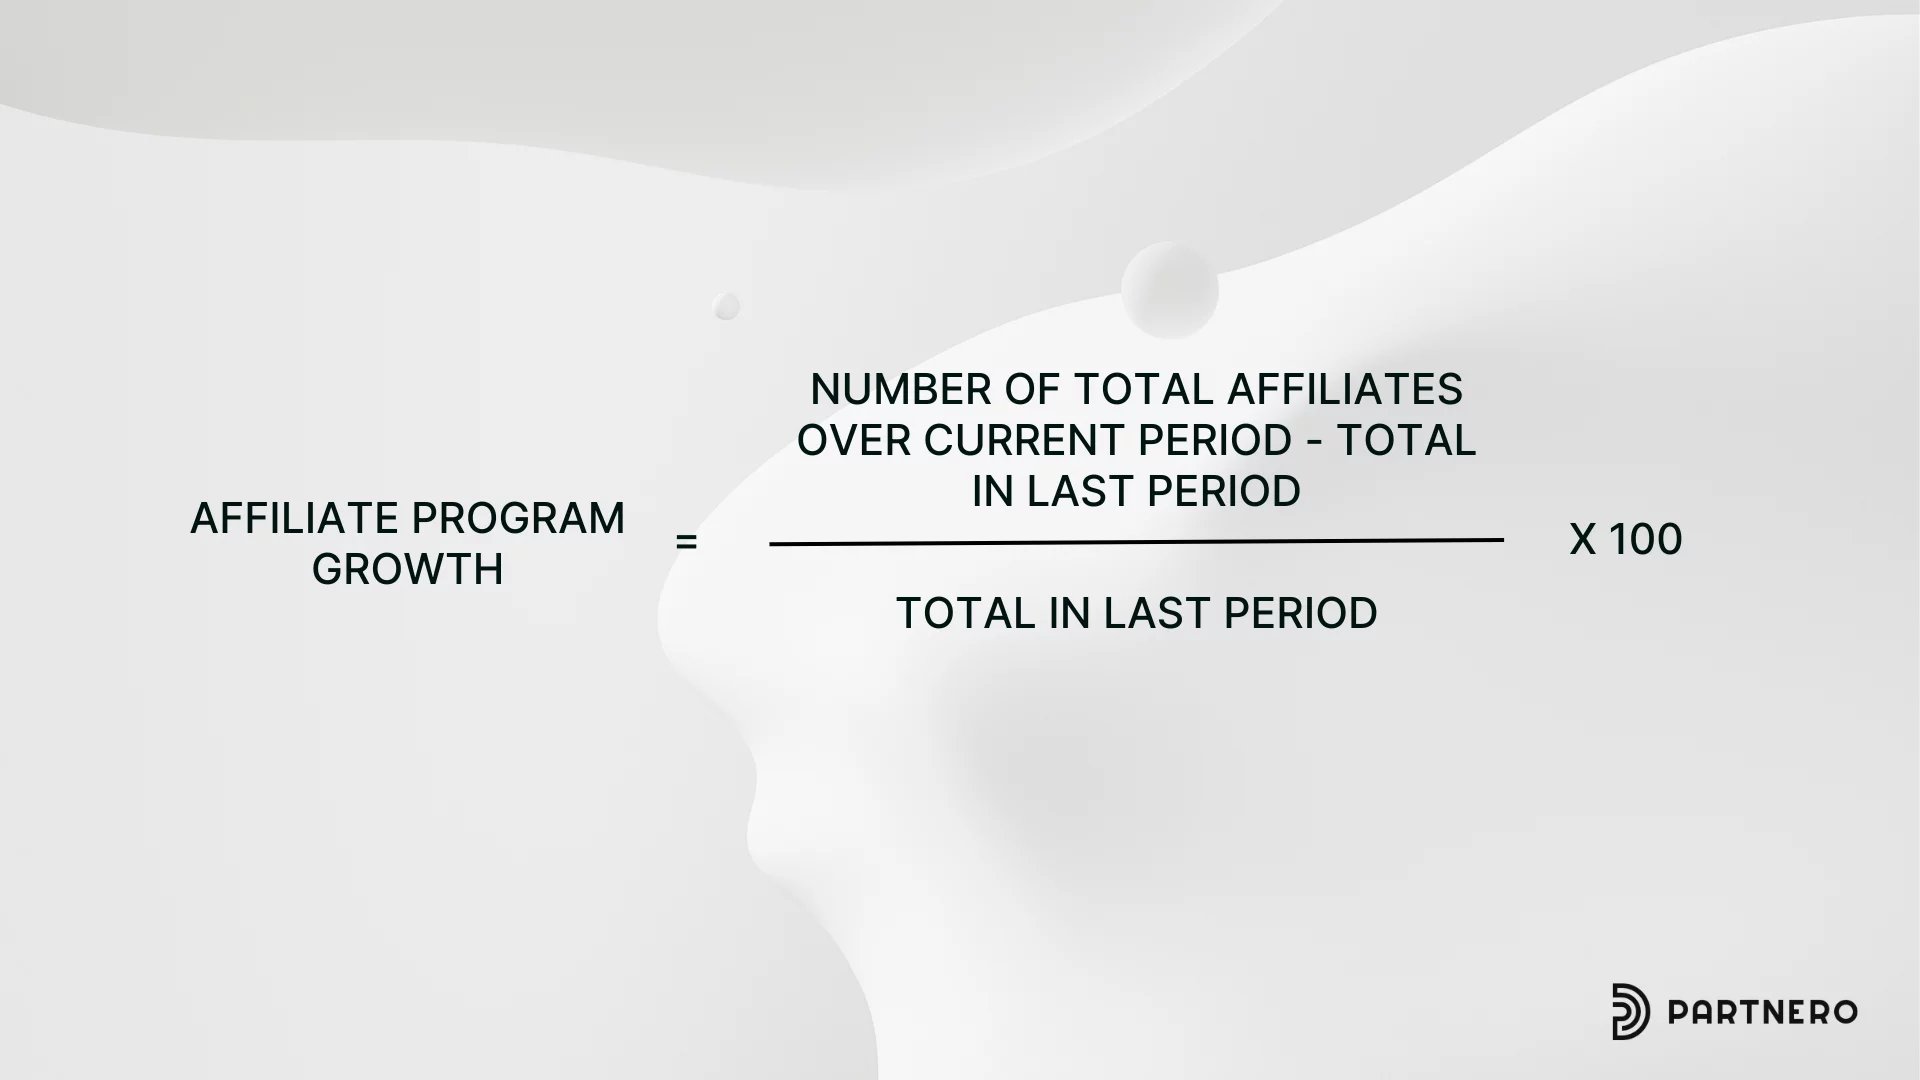
Affiliate Program Growth calculates how many new affiliates join your affiliate network to promote your products and services. This ultimately drives more sales and revenue for your business.
Affiliate Program Growth benchmark
The number of affiliate programs has grown by 10% annually. Fashion, technology, and health & wellness have seen the biggest increases. Growth will look different for different industries and products.
Why it matters: Affiliate program growth directly impacts your revenue, brand awareness, scalability, customer acquisition, and retention! It also impacts your ROI. This metric can be a benchmark or KPI, but is more likely to be a KPI.
21. Return on Investment (ROI)
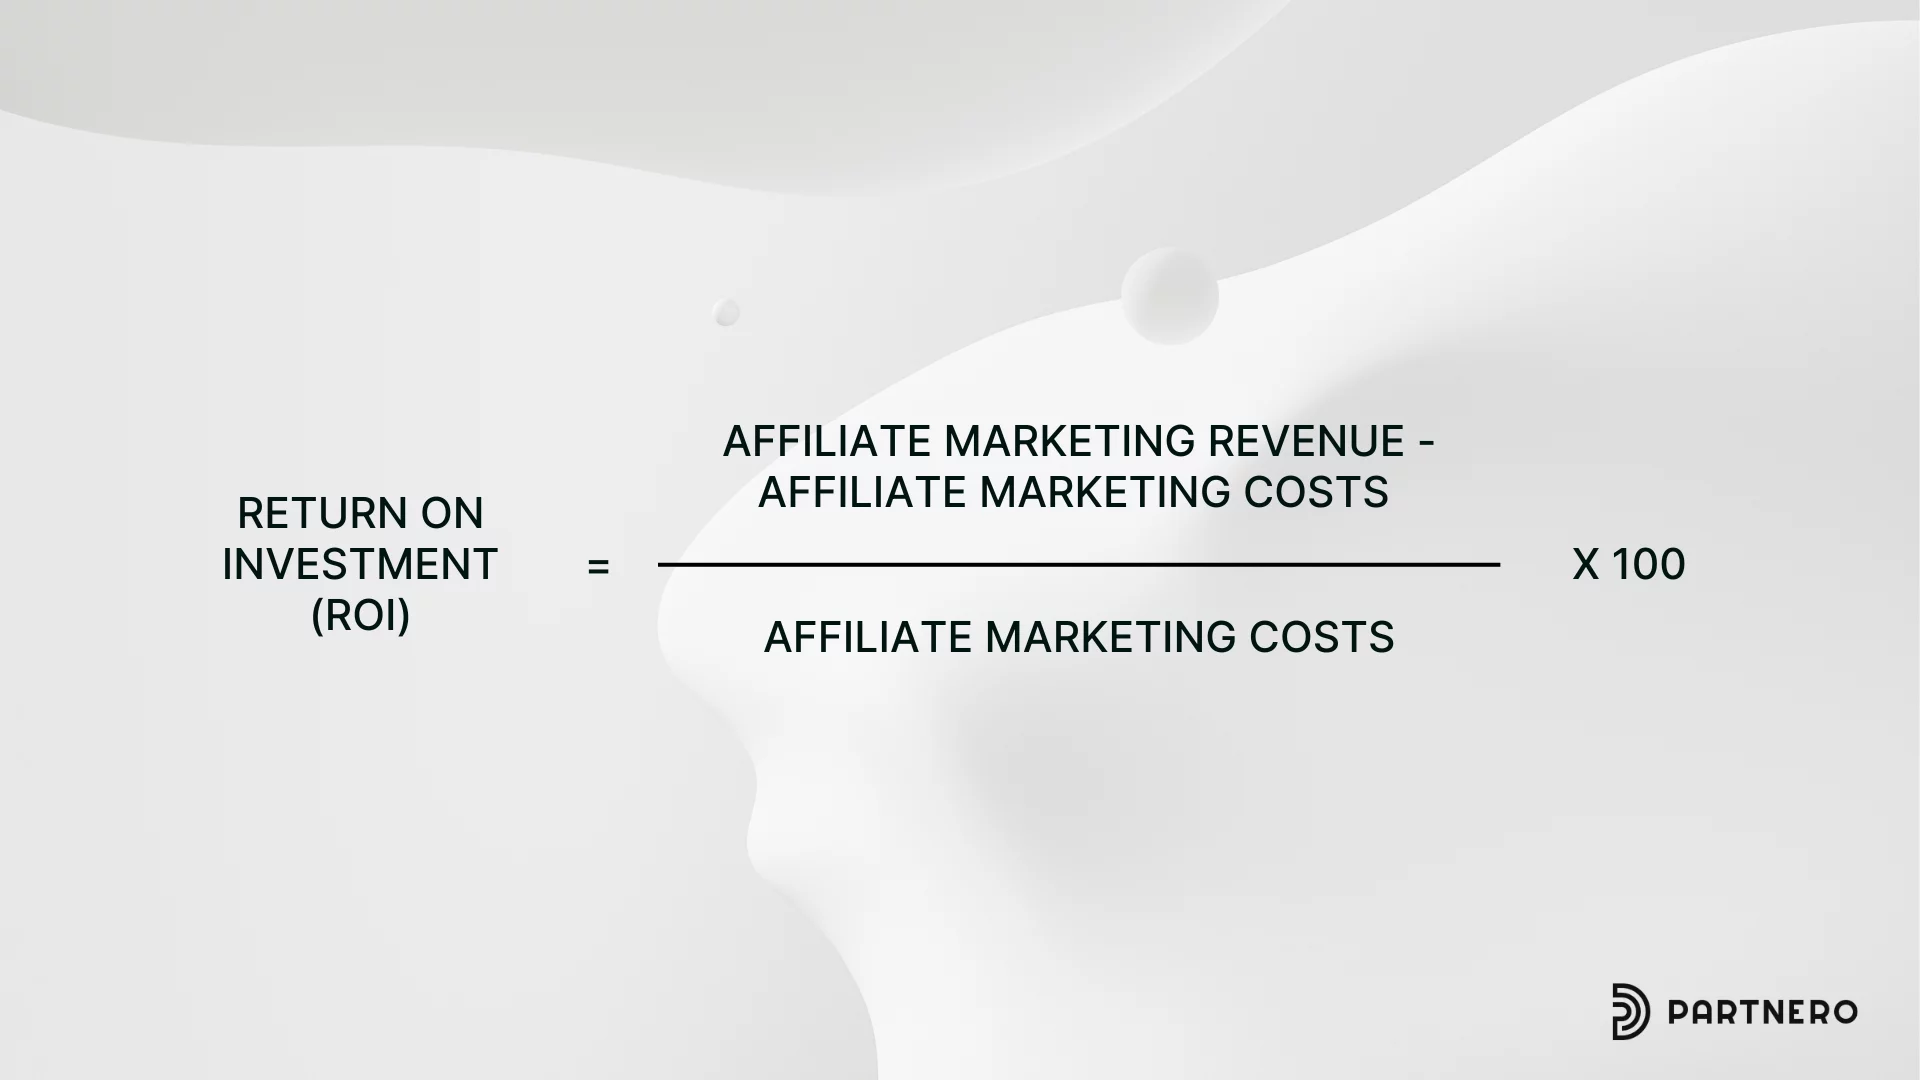
Return on Investment (ROI) in affiliate marketing is a metric that measures the profitability and effectiveness of an affiliate marketing program. ROI in affiliate marketing is calculated by comparing the revenue generated from affiliate marketing activities to the costs associated with running the program. The basic formula is:
Return on Investment (ROI) for affiliate marketing
Affiliate marketing typically offers a high ROI, with some programs achieving a return of $16 for every $1 spent, making it one of the most cost-effective marketing strategies. A "good" ROI in affiliate marketing can vary depending on the industry and specific business goals. However, any positive ROI could be considered good. It indicates profitability. Some marketers might aim for ROIs of 10% or higher!
Why it matters: ROI helps you measure profitability, cost-efficiency, efficacy, performance, resource allocation, and more. This metric can be a benchmark or KPI, but is more likely to be a KPI.
Extra: seasonal and top-performing industries
This isn’t a metric, but knowing seasonal and top-performing industries is important to understand fluctuations throughout the year and in different industries. Many businesses see significant spikes during holiday seasons or industry-specific peak periods. This means your affiliate program may perform better at certain times of the year.
Seasonal and top-performing industries benchmark in affiliate marketing

The highest-earning industries in affiliate marketing include finance (especially credit cards and insurance), health & wellness, and technology. Affiliate programs in these industries will outperform the affiliate benchmark.
Why it matters: Understanding seasonal trends allows you to plan your affiliate marketing strategies accordingly and capitalize on peak periods. While this isn’t a hard metric or a KPI, it’s a great benchmark.
Measure your success and grow with Partnero
Mastering these affiliate marketing KPIs, benchmarks, and metrics is essential for driving success in your affiliate programs. By regularly monitoring and analyzing these metrics, you can make data-driven decisions to optimize your strategies, improve performance, and maximize your return on investment.
By focusing on these key metrics and working to improve them over time, you'll be well-positioned to build a thriving affiliate marketing program that delivers value to your business, your affiliates, and your customers alike.
Remember, while these benchmarks provide useful guidelines, every affiliate program is unique. It's important to establish your baseline metrics and continuously strive for improvement. Regularly review your performance, test new approaches, and stay adaptable in the ever-evolving landscape of affiliate marketing.
With Partnero, you can customize your benchmarks and KPIs to your affiliate marketing goals and objectives. Access valuable information in an all-in-one dashboard on Partnero. Sign up for a free trial now to see it all in action!
Launch your program in minutes or get in touch for advanced setups.